There are two ways to change the legend position in base R plots:
Method 1: Use (x, y) coordinates
legend(4, 12, legend=c('y1', 'y2'), col=c('purple', 'red'), lty=1)
Method 2: Use keywords
legend('bottomright', legend=c('y1', 'y2'), col=c('purple', 'red'), lty=1)
Using this method, you can specify the following locations:
- “bottomright”
- “bottom”
- “bottomleft”
- “left”
- “topleft”
- “top”
- “topright”
- “right”
- “center”
The following examples show how to use each method in practice.
Example 1: Change Legend Position Using (x, y) Coordinates
The following code shows how to create a legend for a plot in base R and place it at x=4 and y=12:
#create data
x #create plot with multiple lines
plot(x, y1, col='purple', type='l', xlab='x', ylab='y')
lines(x, y2, col='red')

#add legend
legend(4, 12, legend=c('y1', 'y2'), col=c('purple', 'red'), lty=1)
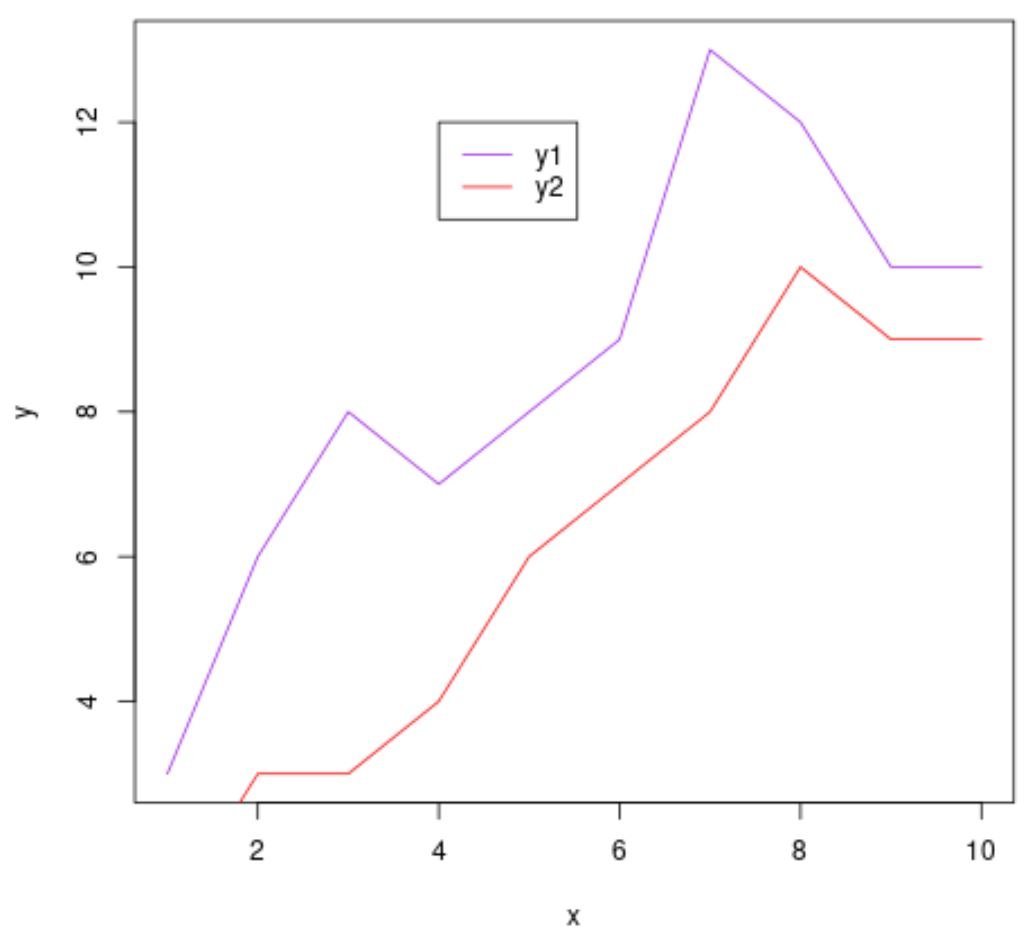
Notice that the legend is placed at the exact (x,y) coordinates that we specified.
Example 2: Change Legend Position Using Keywords
The following code shows how to create a legend for a plot in base R and place it in the top left corner:
#create data
x #create plot with multiple lines
plot(x, y1, col='purple', type='l', xlab='x', ylab='y')
lines(x, y2, col='red')

#add legend
legend('topleft', legend=c('y1', 'y2'), col=c('purple', 'red'), lty=1)
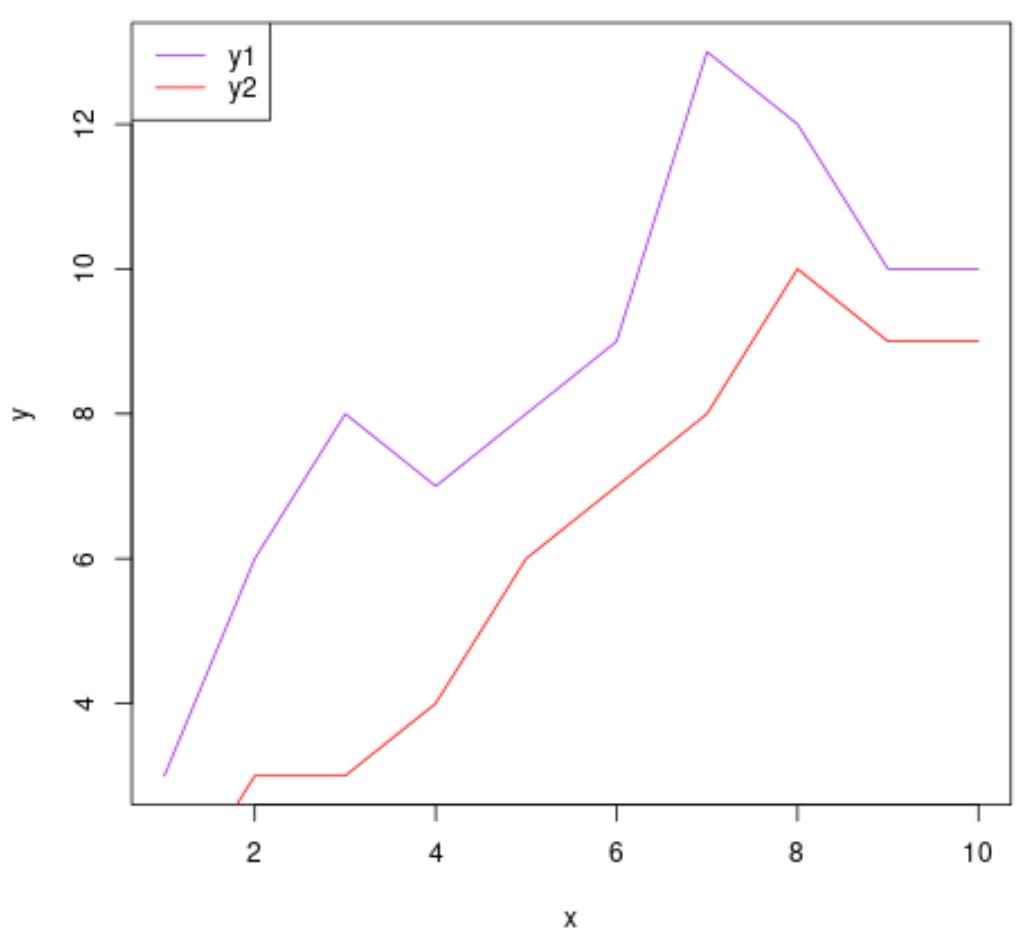
The legend is placed in the top left corner of the plot, just as we specified.
We can easily change it to a different location, such as the bottom right corner, by using a different keyword:
#create data
x #create plot with multiple lines
plot(x, y1, col='purple', type='l', xlab='x', ylab='y')
lines(x, y2, col='red')

#add legend
legend('bottomright', legend=c('y1', 'y2'), col=c('purple', 'red'), lty=1)

The legend is now placed in the bottom right corner of the plot.
Related: How to Draw a Legend Outside of a Plot in R
Additional Resources
The following tutorials explain how to perform other common tasks in R:
How to Plot Multiple Lines in One Chart in R
How to Plot Line of Best Fit in R
How to Use abline() in R