The abline function in R can be used to add a straight line to a plot.
Unfortunately this function doesn’t exist in Matplotlib, but we can define the following function to replicate the abline function in Python:
import matplotlib.pyplot as plt
import numpy as np

def abline(slope, intercept):
    axes = plt.gca()
    x_vals = np.array(axes.get_xlim())
    y_vals = intercept + slope * x_vals
    plt.plot(x_vals, y_vals, '--')
The following examples show how to use this syntax in practice with the following pandas DataFrame:
import pandas as pd

#create DataFrame
df = pd.DataFrame({'x': [1, 1, 2, 3, 4, 4, 5, 6, 7, 7, 8, 9, 10, 11],
                   'y': [13, 14, 17, 12, 23, 24, 25, 25, 24, 28, 32, 33, 35, 40]})

#view first five rows of DataFrame
df.head()

	x	y
0	1	13
1	1	14
2	2	17
3	3	12
4	4	23
Example 1: Use abline to Plot Horizontal Line
We can use the following code to plot a horizontal line with the abline function defined earlier:
#create scatterplot
plt.scatter(df.x, df.y)

#add horizontal line at y=30
abline(0, 30)

The result is a horizontal line at y=30.
Example 2: Use abline to Plot Line with Specific Slope & Intercept
We can use the following code to plot a straight line with a slope of 3 and an intercept of 15:
#create scatterplot
plt.scatter(df.x, df.y)

#add straight line with slope=3 and intercept=15
abline(3, 15)

The result is a straight line with a slope of 3 and an intercept of 15.
Example 3: Use abline to Plot Regression Line
We can use the following code to plot a regression line with the abline function defined earlier:
#calculate slope and intercept of regression line
slope = np.polyfit(df.x, df.y,1)[0]
intercept = np.polyfit(df.x, df.y,1)[1]

#create scatterplot
plt.scatter(df.x, df.y)

#add regression line
abline(slope, intercept)
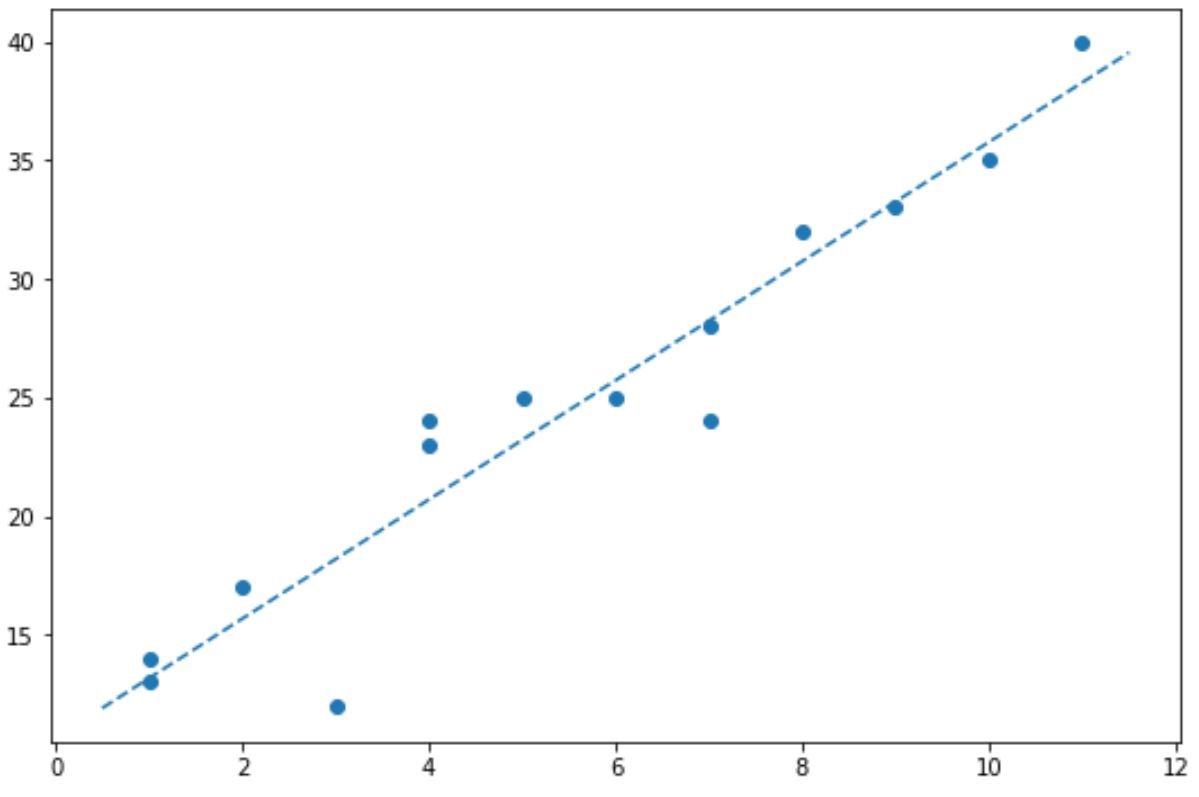
The result is a fitted regression line that runs directly through the points in the plot.
Note: You can find the complete documentation for the polyfit function in NumPy here.
Additional Resources
The following tutorials explain how to perform other common tasks in pandas:
How to Sum Specific Columns in Pandas
How to Sum Columns Based on a Condition in Pandas
How to Calculate a Reversed Cumulative Sum in Pandas