In statistics, the Gamma distribution is often used to model probabilities related to waiting times.
The following examples show how to use the scipy.stats.gamma() function to plot one or more Gamma distributions in Python.
Example 1: Plot One Gamma Distribution
The following code shows how to plot a Gamma distribution with a shape parameter of 5 and a scale parameter of 3 in Python:
import numpy as np
import scipy.stats as stats
import matplotlib.pyplot as plt

#define x-axis values
x = np.linspace (0, 40, 100)

#calculate pdf of Gamma distribution for each x-value
y = stats.gamma.pdf(x, a=5, scale=3)

#create plot of Gamma distribution
plt.plot(x, y)

#display plot
plt.show()

The x-axis displays the potential values that a Gamma distributed random variable can take on and the y-axis shows the corresponding PDF values of the Gamma distribution with a shape parameter of 5 and scale parameter of 3.
Example 2: Plot Multiple Gamma Distributions
The following code shows how to plot multiple Gamma distributions with various shape and scale parameters:
import numpy as np
import scipy.stats as stats
import matplotlib.pyplot as plt

#define three Gamma distributions
x = np.linspace(0, 40, 100)
y1 = stats.gamma.pdf(x, a=5, scale=3)
y2 = stats.gamma.pdf(x, a=2, scale=5)
y3 = stats.gamma.pdf(x, a=4, scale=2)

#add lines for each distribution
plt.plot(x, y1, label=shape=5, scale=3')
plt.plot(x, y2, label='shape=2, scale=5')
plt.plot(x, y3, label='shape=4, scale=2')

#add legend
plt.legend()

#display plot
plt.show()
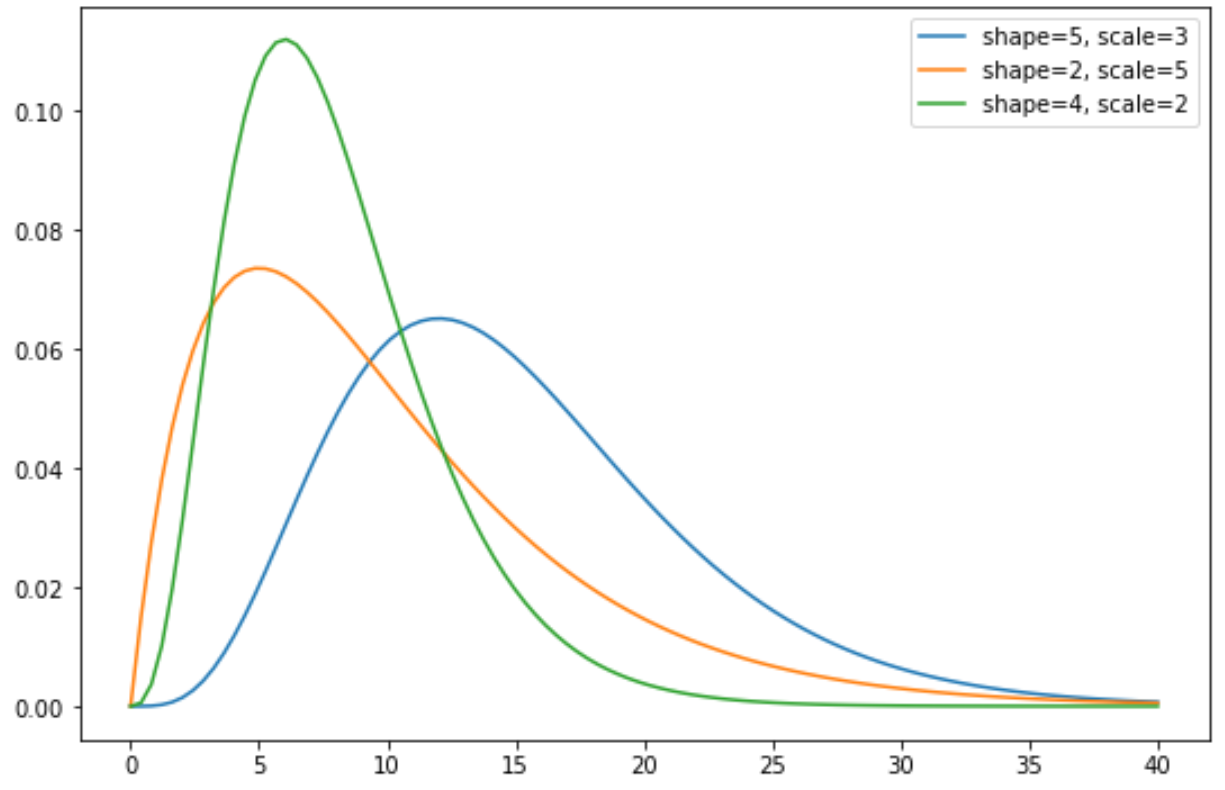
Notice that the shape of the Gamma distribution can vary quite a bit depending on the shape and scale parameters.
Related: How to Plot Multiple Lines in Matplotlib
Additional Resources
The following tutorials explain how to plot other common distributions in Python:
How to Plot a Normal Distribution in Python
How to Plot a Chi-Square Distribution in Python