When creating a scatter plot, it can be helpful to jitter the points so that it’s easier to view points that may be overlapping.
The easiest way to jitter points in ggplot2 is to use geom_jitter(), which uses the following basic syntax:
ggplot(df, aes(x=x, y=y)) +
  geom_jitter()
The following examples show how to use the geom_jitter() function in practice with the following data frame in R:
#create data frame
df frame(x=c(4, 4, 4, 4, 6, 6, 6, 6, 8, 8, 8, 8),
                 y=c(3, 3, 3, 3, 7, 7, 7, 7, 9, 9, 9, 9))

#view data frame
df

   x y
1  4 3
2  4 3
3  4 3
4  4 3
5  6 7
6  6 7
7  6 7
8  6 7
9  8 9
10 8 9
11 8 9
12 8 9
Example 1: Create Scatter Plot without Jitter
The following code shows how to create a scatter plot in ggplot2 without using any jitter:
library(ggplot2)

#create scatter plot
ggplot(df, aes(x=x, y=y)) +
  geom_point()
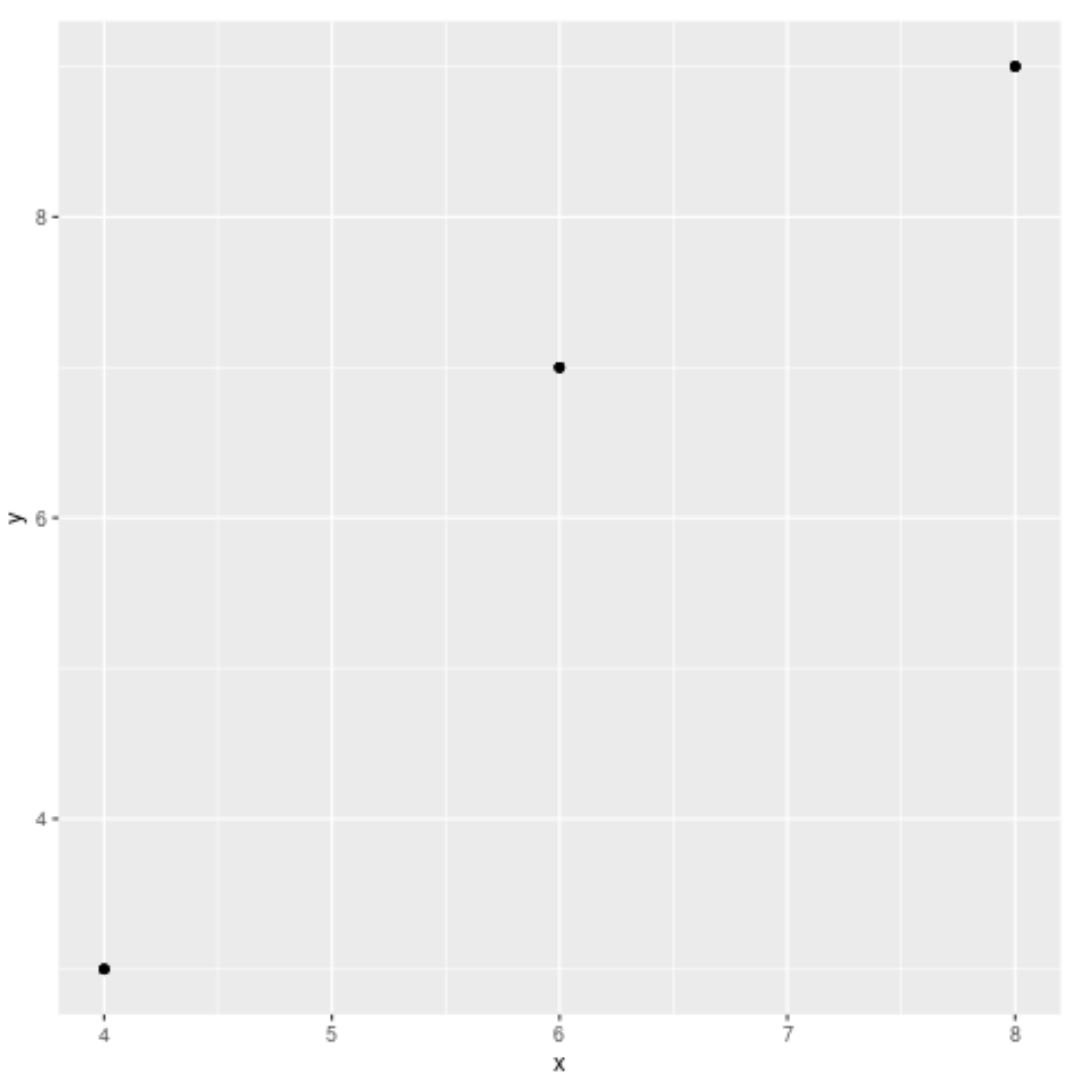
The original data frame has 12 observations, but since several of the observations have the same x and y values it looks like there are only 3 observations in the scatter plot.
Example 2: Create Scatter Plot with Default Jitter
The following code shows how to create a scatter plot in ggplot2 with the default settings in geom_jitter():
library(ggplot2)

#create scatter plot with jittered points
ggplot(df, aes(x=x, y=y)) +
  geom_jitter()
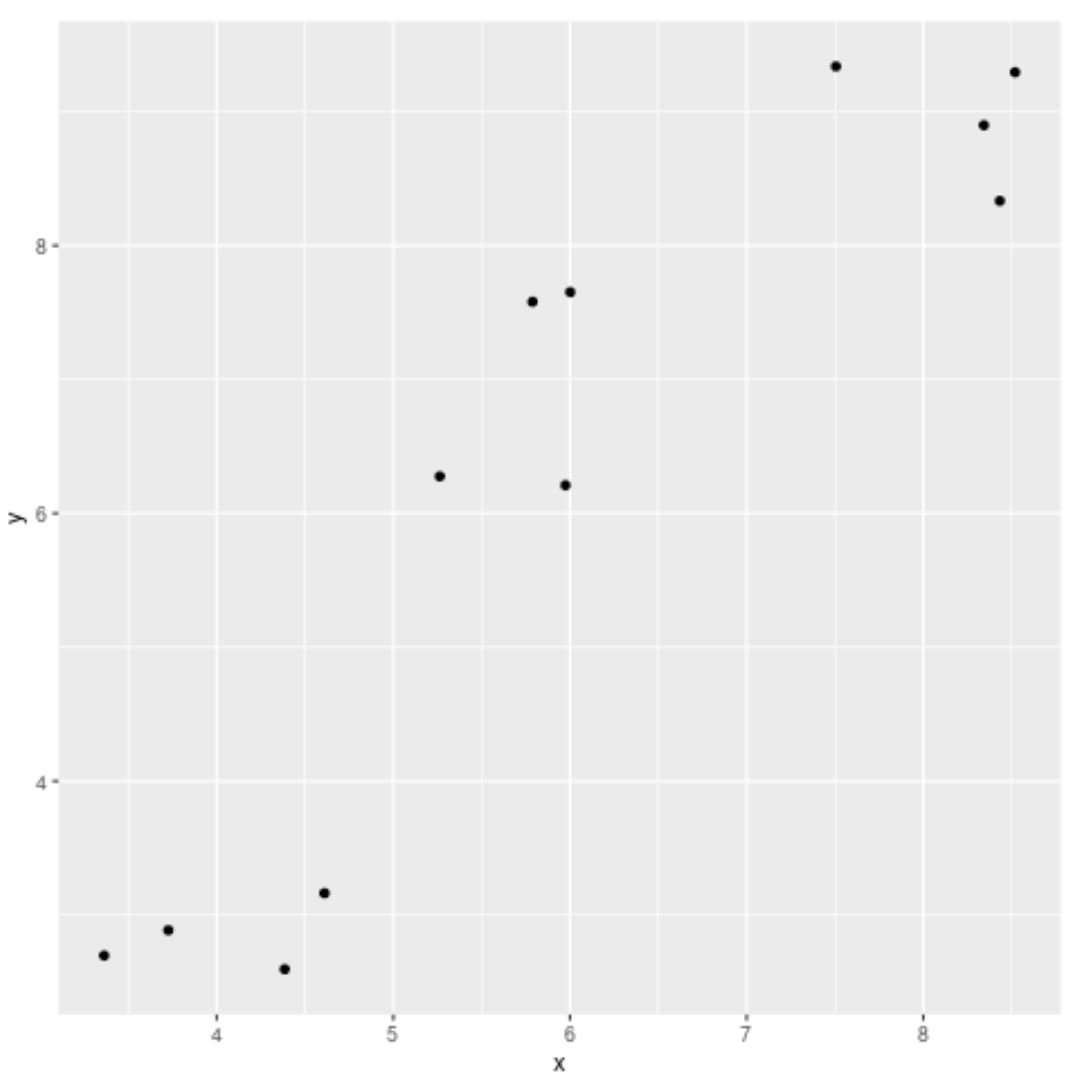
Notice that each of the 12 observations are now visible in the scatter plot since we used geom_jitter() to add random noise to both the width and height of each point.
Example 3: Create Scatter Plot with Custom Jitter
The following code shows how to create a scatter plot in ggplot2 with custom values for the width and height arguments in geom_jitter():
library(ggplot2)

#create scatter plot with jittered points
ggplot(df, aes(x=x, y=y)) +
  geom_jitter(width=0.2, height=0.2)
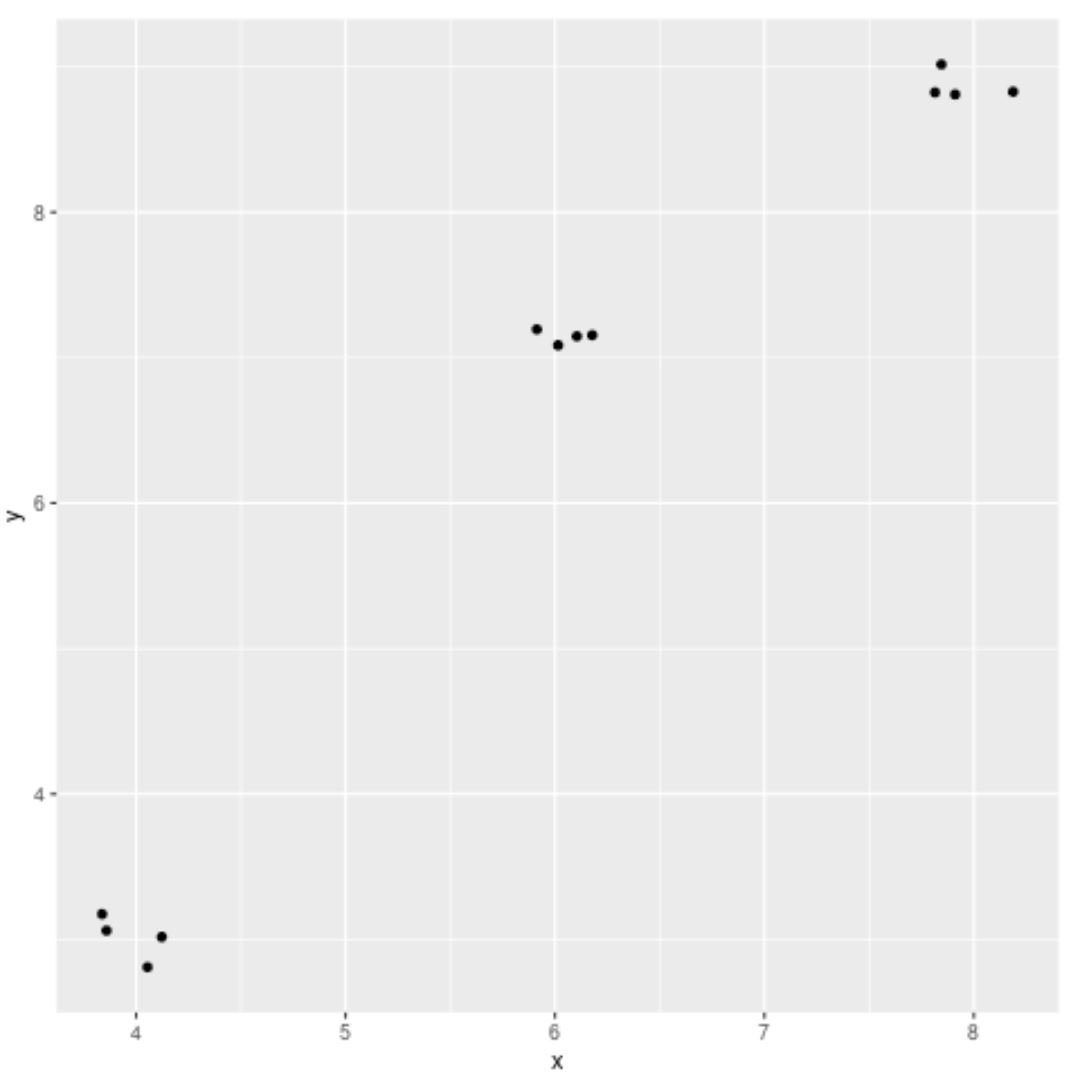
Notice that the points have been jittered, but are much less spread out than in the previous example.
The smaller the values that you use for the width and height arguments in geom_jitter(), the less spread out the points will be from their original positions.
Feel free to play around with the width and height arguments to jitter the points to whatever degree you’d like.
Additional Resources
The following tutorials explain how to perform other common operations in ggplot2:
How to Change Point Shape in ggplot2
How to Change the Legend Title in ggplot2
How to Rotate Axis Labels in ggplot2
How to Fix in R: could not find function “ggplot”