Levene’s Test is used to determine whether two or more groups have equal variances.
It is widely used because many statistical tests use the assumption that groups have equal variances.
This tutorial explains how to perform Levene’s Test in SPSS.
Example: Levene’s Test in SPSS
Researchers want to know if three different fertilizers lead to different levels of plant growth.
They randomly select 30 different plants and split them into three groups of 10, applying a different fertilizer to each group. At the end of one month they measure the height of each plant.
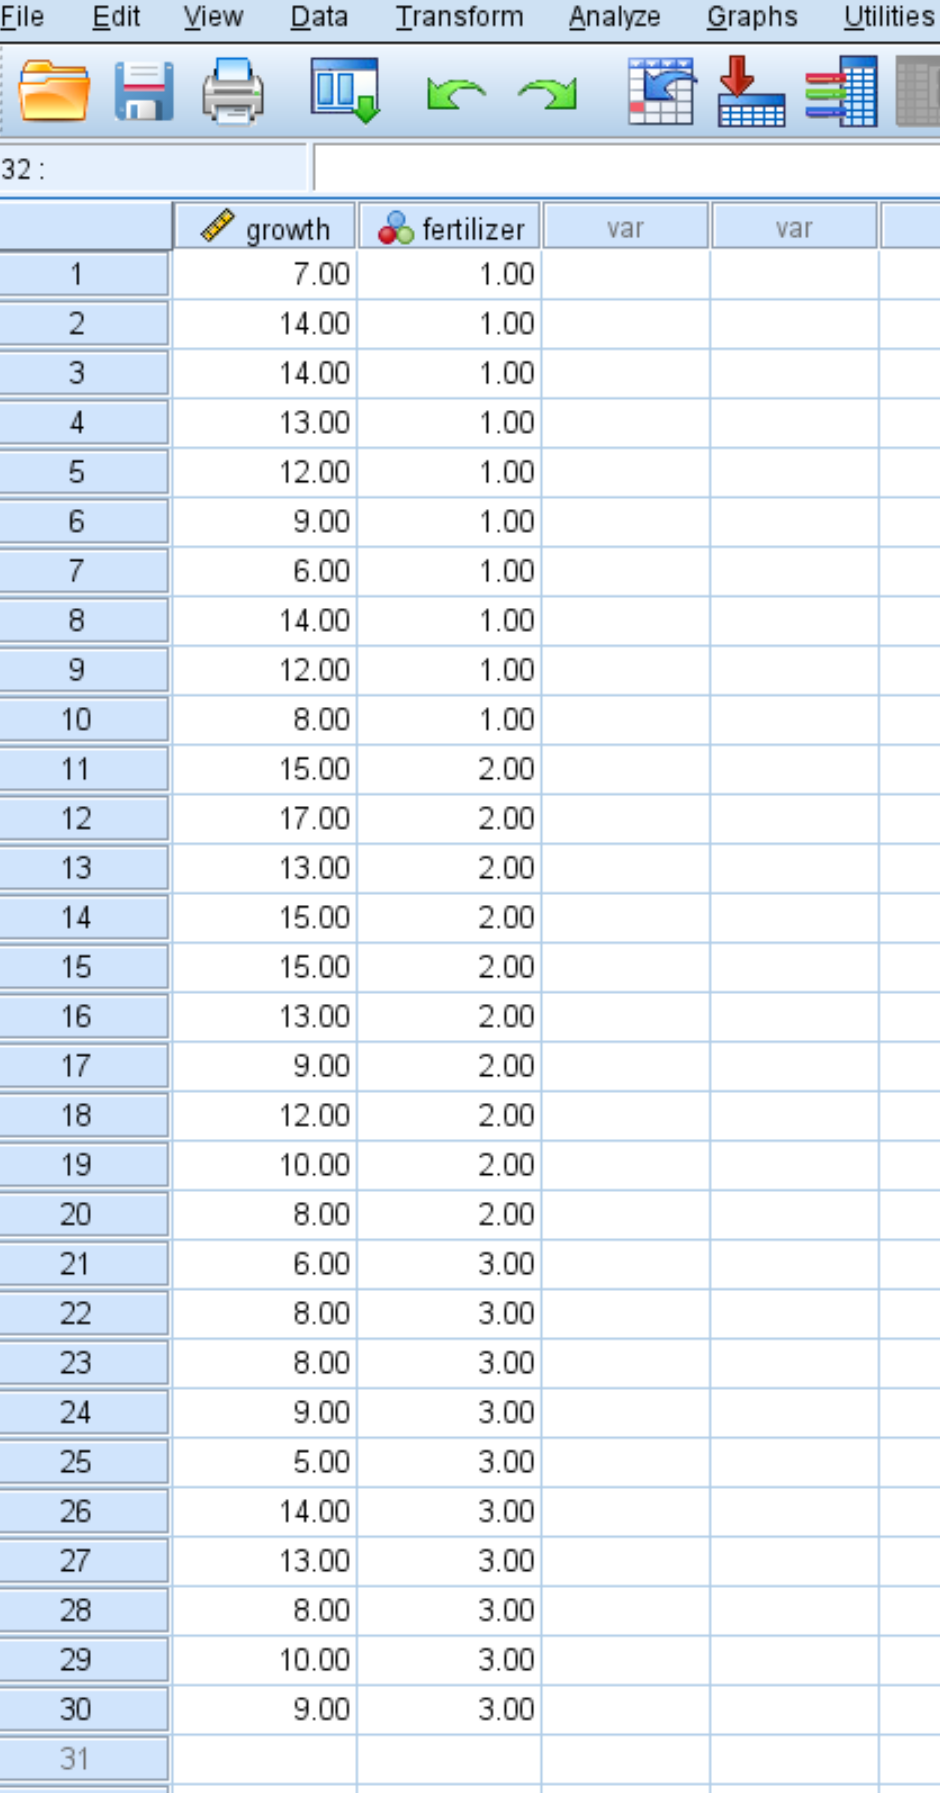
The following screenshot shows the amount of growth (in inches) for each individual plant, along with the fertilizer (1, 2, or 3) that was applied to the plant:
Use the following steps to perform Levene’s Test in SPSS to determine whether or not the three groups have equal variances.
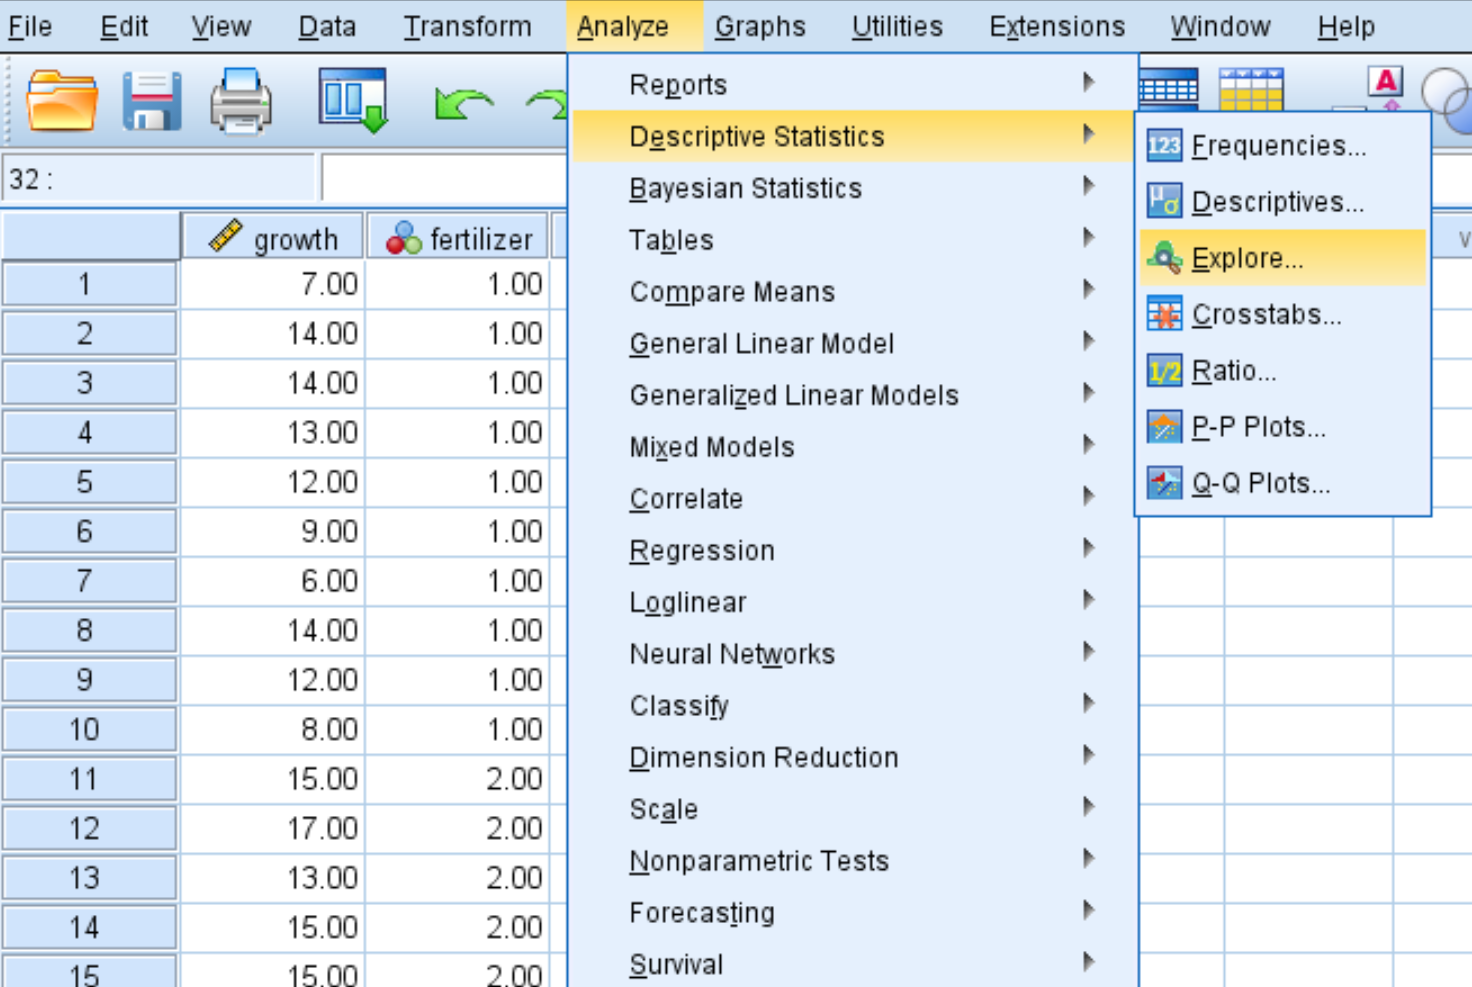
Step 1: Choose the Explore option.
Click the Analyze tab, then Descriptive Statistics, then Explore:
Step 2: Fill in the necessary values to perform the test.
Drag growth into the box under Dependent List and drag fertilize into the box under Factor List.
Then click Plots and make sure Power estimation is selected. Then click continue. Then click OK.

Step 3: Interpret the results.
Once you click OK, the results of Levene’s test will be displayed:
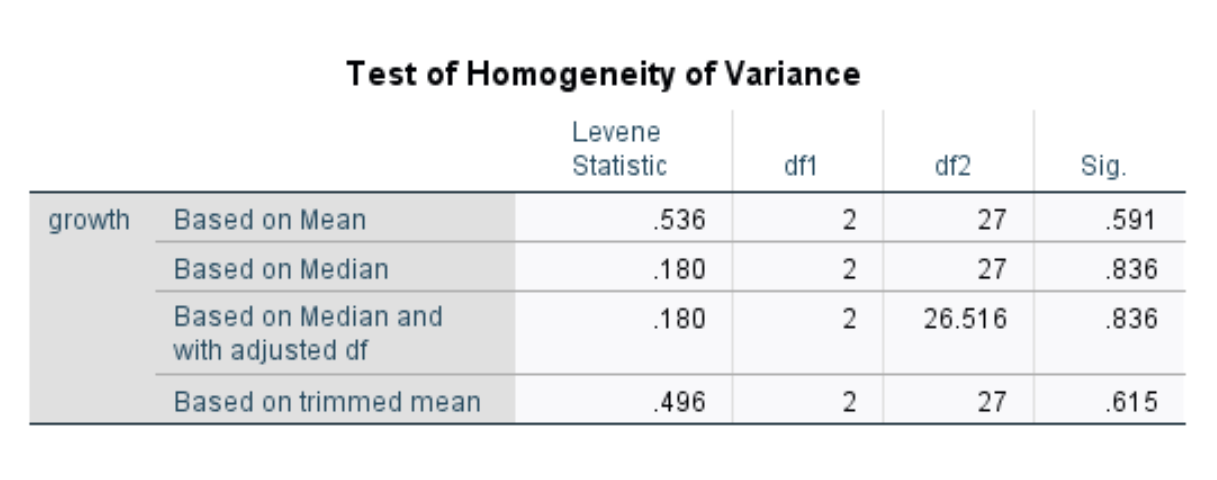
This table displays the test statistic for four different versions of Levene’s Test. The numbers we’re interested in are in the first row, which displays the results of Levene’s Test based on the mean.
The test statistic is .536 and the corresponding p-value is .591*.
Since this p-value is not less than .05, we fail to reject the null hypothesis.
This means we do not have sufficient evidence to say that the variance in plant growth between the three fertilizers is significantly different.
In other words, the three groups have equal variances. If we were to perform some statistical test (like a one-way ANOVA) that assumes each group has equal variance, then this assumption would be met.
*This p-value correspond to an F statistic of .536 with numerator df = 2 and denominator df = 27. This p-value can also be calculated using the F Distribution Calculator.