The Poisson distribution is one of the most commonly used distributions in statistics.
In Excel, we can use the POISSON.DIST() function to find the probability that an event occurs a certain number of times during a given interval, based on knowing the mean number of times the event occurs during the given interval.
The syntax for POISSON.DIST is as follows:
POISSON.DIST(x, mean, cumulative)
- x: number of occurrences during a given interval
- mean: mean number of occurrences during a given interval
- cumulative: TRUE returns the cumulative probability; FALSE returns the exact probability
The following examples illustrate how to solve Poisson probability questions using POISSON.DIST.
Example 1
A hardware store sells 3 hammers per day on average. What is the probability that they will sell 5 hammers on a given day?
In this example, we can plug in the following numbers to the POISSON.DIST function:
- x: number of occurrences during a given interval (selling 5 hammers)
- mean: mean number of occurrences during a given interval (they sell 3 on average)
- cumulative: FALSE (we want an exact probability, not a cumulative probability)
To answer this question, we can use the following formula in Excel: POISSON.DIST(5, 3, FALSE)
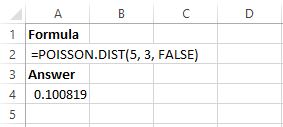
The probability that the store sells 5 hammers in a given day is 0.100819.
Example 2
A certain store sells 15 cans of tuna per day on average. What is the probability that this store sells more than 20 cans of tuna in a given day?
In this example, we can plug in the following numbers to the POISSON.DIST function:
- x: number of occurrences during a given interval (selling 20 cans)
- mean: mean number of occurrences during a given interval (they sell 15 cans on average)
- cumulative: TRUE (we want a cumulative probability, not an exact probability)
To answer this question, we can use the following formula in Excel: 1 – POISSON.DIST(20, 15, TRUE)
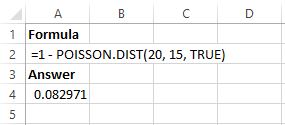
The probability that the store sells more than 20 cans of tuna in a given day is 0.082971.
Note: In this example, POISSON.DIST(20, 15, TRUE) returns the probability that the store sells 20 or fewer cans of tuna. So, to find the probability that the store sells more than 20 cans, we simply use 1 – POISSON.DIST(20, 15, TRUE).
Example 3
A certain sporting goods store sells seven basketballs per day on average. What is the probability that this store sells four or less basketballs in a given day?
In this example, we can plug in the following numbers to the POISSON.DIST function:
- x: number of occurrences during a given interval (selling 4 basketballs)
- mean: mean number of occurrences during a given interval (they sell 7 on average)
- cumulative: TRUE (we want a cumulative probability, not an exact probability)
To answer this question, we can use the following formula in Excel: POISSON.DIST(4, 7, TRUE)
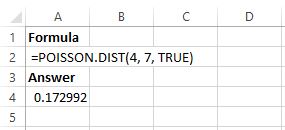
The probability that the store sells 4 or fewer basketballs in a given day is 0.172992.
Example 4
A certain store sells twelve pineapples per day on average. What is the probability that this store sells between 12 and 14 pineapples in a given day?
In this example, we can plug in the following numbers to the POISSON.DIST function:
- x: number of occurrences during a given interval (selling between 12 and 14 pineapples)
- mean: mean number of occurrences during a given interval (they sell 12 on average)
- cumulative: TRUE (we want a cumulative probability, not an exact probability)
To answer this question, we can use the following formula in Excel:
POISSON.DIST(14, 12, TRUE) – POISSON.DIST(11, 12, TRUE)
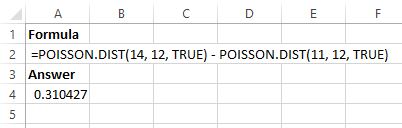
The probability that the store sells between 12 and 14 pineapples in a given day is 0.310427.
Note: In this example, POISSON.DIST(14, 12, TRUE) returns the probability that the store sells 14 or fewer pineapples and POISSON.DIST(11, 12, TRUE) returns the probability that the store sells 11 or fewer pineapples . So, to find the probability that the store sells between 12 and 14 titles, we subtract the difference so that we are actually finding the probability that the store sells either 12, 13, or 14 pineapples.
An alternative way to solve this problem is to simply find the individual probabilities of selling 12, 13, and 14 pineapples, and then add up these probabilities:
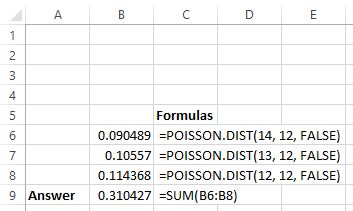
This gives us the same probability as the previous method.