You can use the following syntax to create a legend in ggplot2 with multiple rows:
ggplot(df, aes(x=x_var, y=y_var, color=group_var)) +
  geom_point() +
  guides(color=guide_legend(nrow=2, byrow=TRUE))
The value for the nrow argument specifies the number of rows to use in the legend.
The following example shows how to use this syntax in practice.
Example: Create Legend in ggplot2 with Multiple Rows
Suppose we have the following data frame in R that contains information about various basketball players:
#create data frame
df frame(team=c('Mavs', 'Heat', 'Nets', 'Lakers', 'Suns', 'Cavs'),
                 points=c(24, 20, 34, 39, 28, 29),
                 assists=c(5, 7, 6, 9, 12, 13))

#view data frame
df

    team points assists
1   Mavs     24       5
2   Heat     20       7
3   Nets     34       6
4 Lakers     39       9
5   Suns     28      12
6   Cavs     29      13
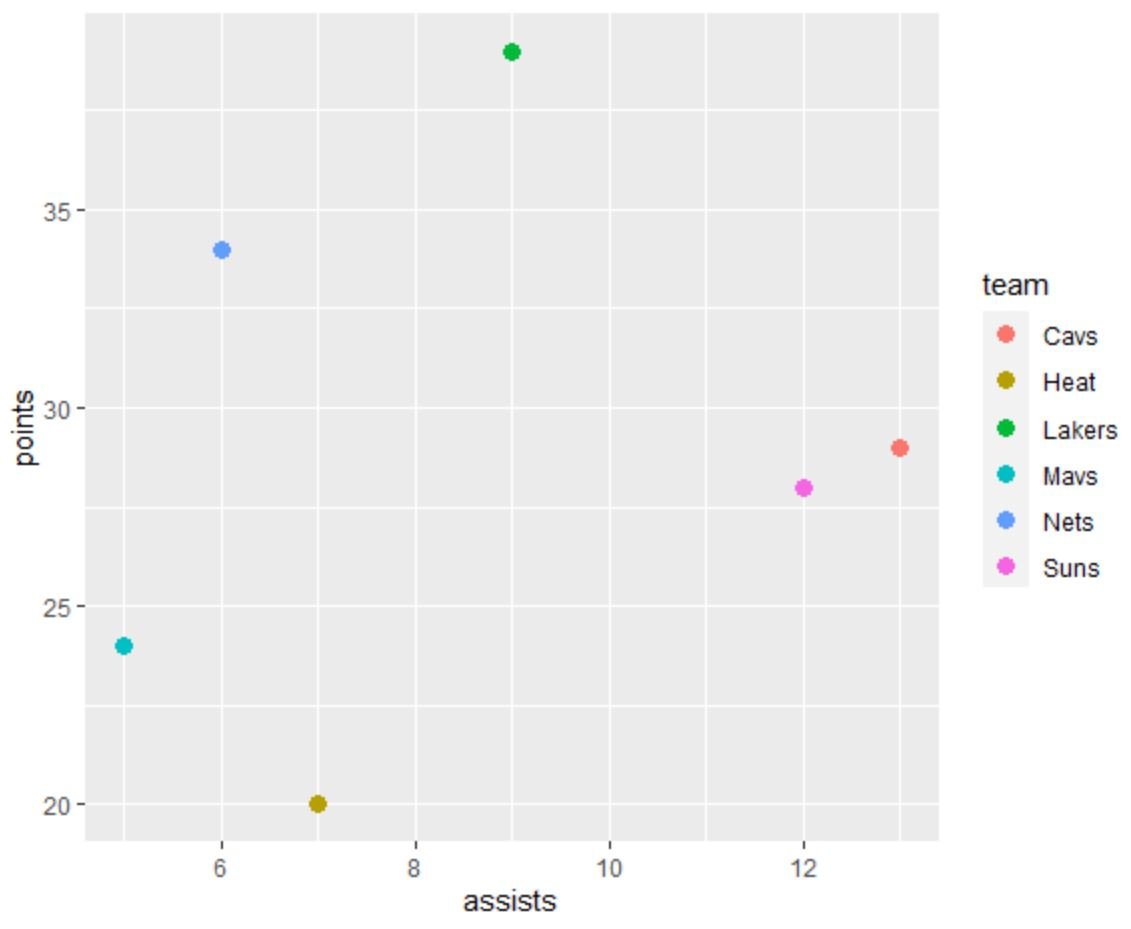
If we create a scatter plot in ggplot2 without specifying the number of rows to use in the legend, ggplot2 will place one label on each line by default:
library(ggplot2)

#create default scatterplot
ggplot(df, aes(x=assists, y=points, color=team)) +
  geom_point(size=3)
In order to create a legend with multiple rows, we must use the guides() function with the nrow argument:
library(ggplot2)

#create scatterplot with two rows in legend
ggplot(df, aes(x=assists, y=points, color=team)) +
  geom_point(size=3) +
  guides(color=guide_legend(nrow=2, byrow=TRUE))
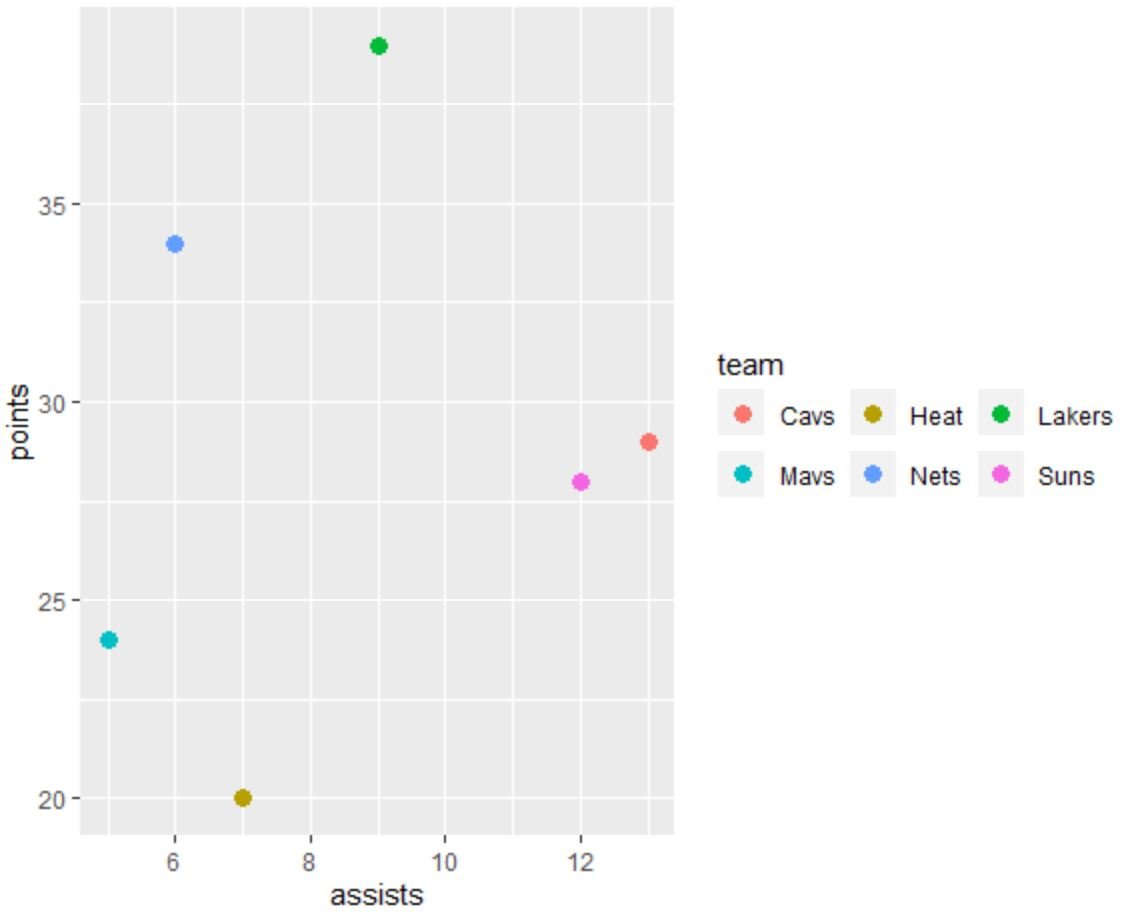
Notice that the legend now has two rows.
If we’d like to change the location of the legend as well, we can use the theme() function with the legend.position argument:
library(ggplot2)

#create scatterplot with two rows in legend
ggplot(df, aes(x=assists, y=points, color=team)) +
  geom_point(size=3) +
  theme(legend.position='bottom') +
  guides(color=guide_legend(nrow=2, byrow=TRUE))
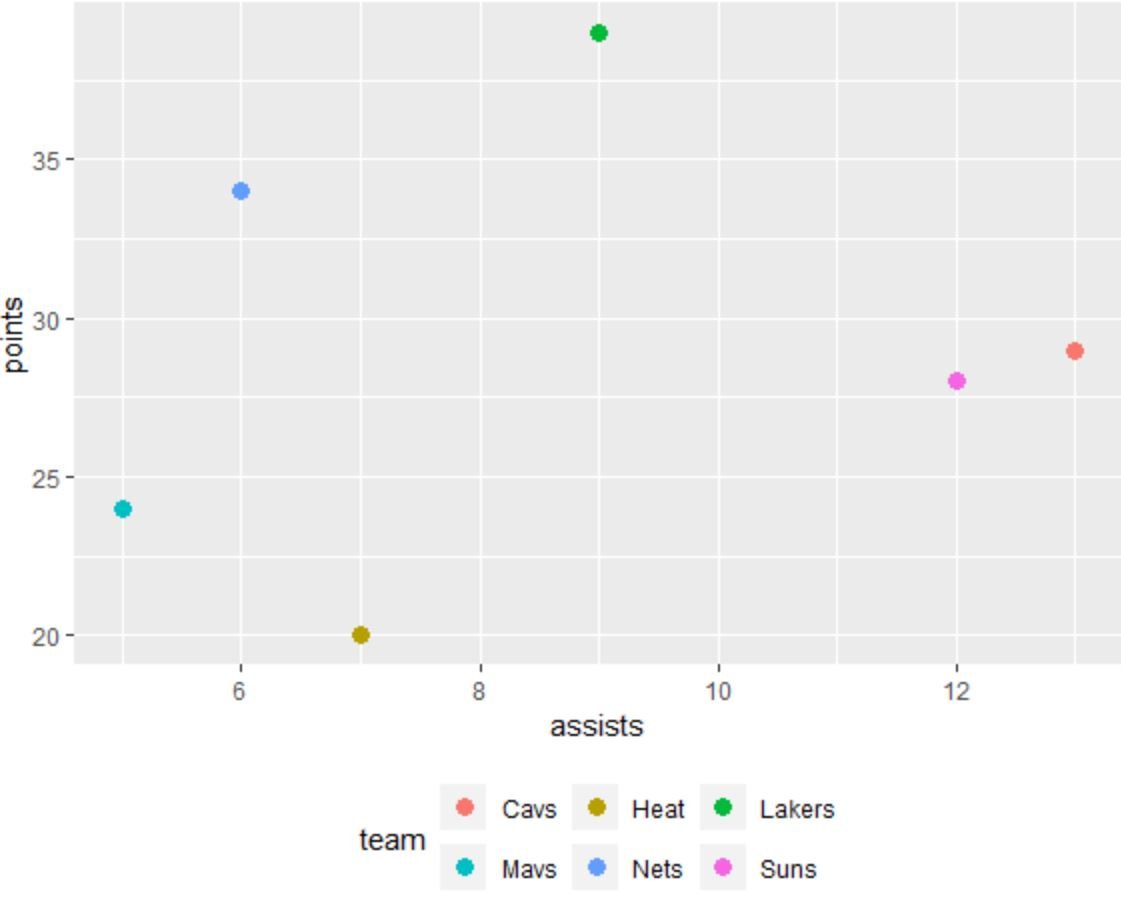
The legend is now located at the bottom of the plot and it has two rows.
Additional Resources
The following tutorials explain how to perform other common operations in ggplot2:
How to Change the Legend Title in ggplot2
How to Change Legend Size in ggplot2
How to Change Legend Position in ggplot2