You can use the DEVSQ function in Excel to calculate the sum of squares of deviations for a given sample.
This function uses the following basic syntax:
=DEVSQ(value1, value2, value3, ...)
Here’s the formula that DEVSQ actually uses:
Sum of squares of deviations = Σ(xi – x)2
where:
- xi: The ith data value
- x: The sample mean
The following example shows how to use this function in practice.
Example: How to Use DEVSQ in Excel
Suppose we have the following dataset in Excel:

We can use the following formula to calculated the sum of squares of deviations for this dataset:
=DEVSQ(A2:A13)
The following screenshot shows how to use this formula in practice:
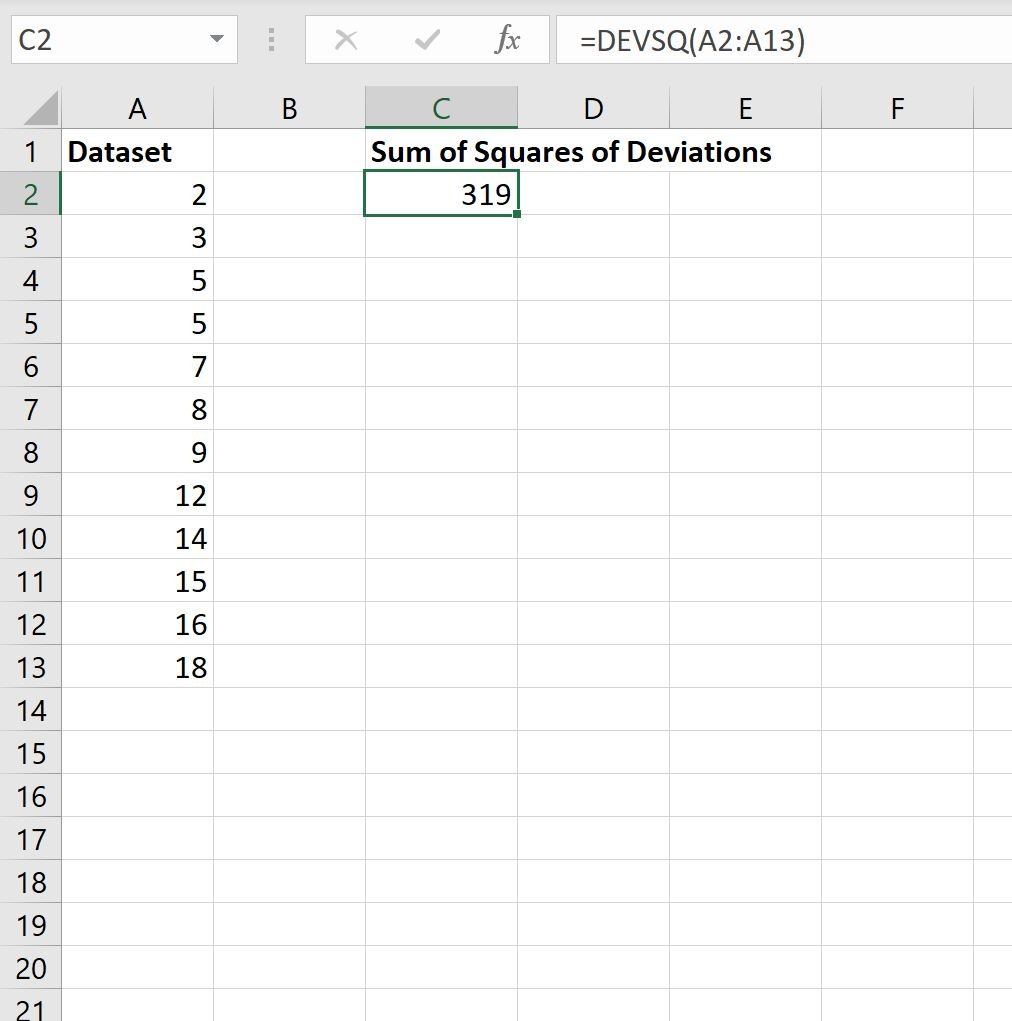
The sum of squares of deviations turns out to be 319.
We can confirm this is correct by manually calculating the sum of squares of deviations for this dataset.
Note: The average value of this dataset is 9.5.
Knowing this, we can simply plug in the values from the dataset into the formula for sum of squares of deviations:
- Sum of squares of deviations = Σ(xi – x)2
- Sum of squares of deviations = (2-9.5)2 + (3-9.5)2 + (5-9.5)2 + (5-9.5)2 + (7-9.5)2 + (8-9.5)2 + (9-9.5)2 + (12-9.5)2 + (14-9.5)2 + (15-9.5)2 + (16-9.5)2 + (18-9.5)2
- Sum of squares of deviations = 56.25 + 42.25 + 20.25 + 20.25 + 6.25 + 2.25 + 0.25 + 6.25 + 20.25 + 30.25 + 42.25 + 72.25
- Sum of squares of deviations = 319
The sum of squares of deviations turns out to be 319.
This matches the value that we calculated using the DEVSQ function.
Additional Resources
The following tutorials explain how to perform other common operations in Excel:
How to Perform a Median IF Function in Excel
How to Perform a Percentile IF Function in Excel
How to Use LARGE IF Function in Excel