You can use the following syntax to add a title to a plot in Matplotlib:
plt.title('My Title')
The following examples show how to use this syntax in practice.
Example 1: Add Title to Plot
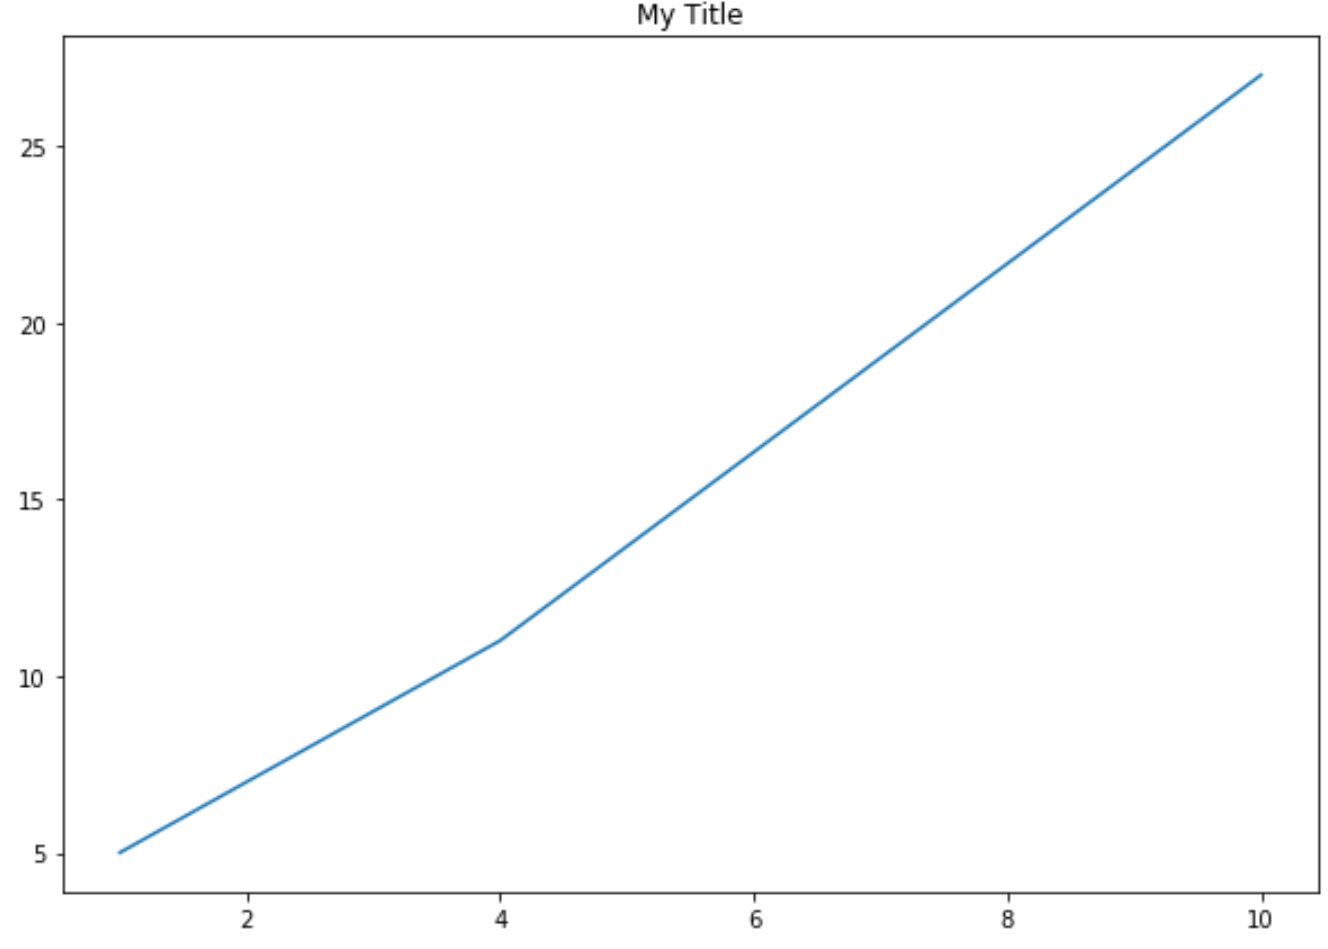
The following code shows how to add a title to a plot in Matplotlib:
import matplotlib.pyplot as plt

#define x and y
x = [1, 4, 10]
y = [5, 11, 27]

#create plot of x and y
plt.plot(x, y)

#add title
plt.title('My Title')
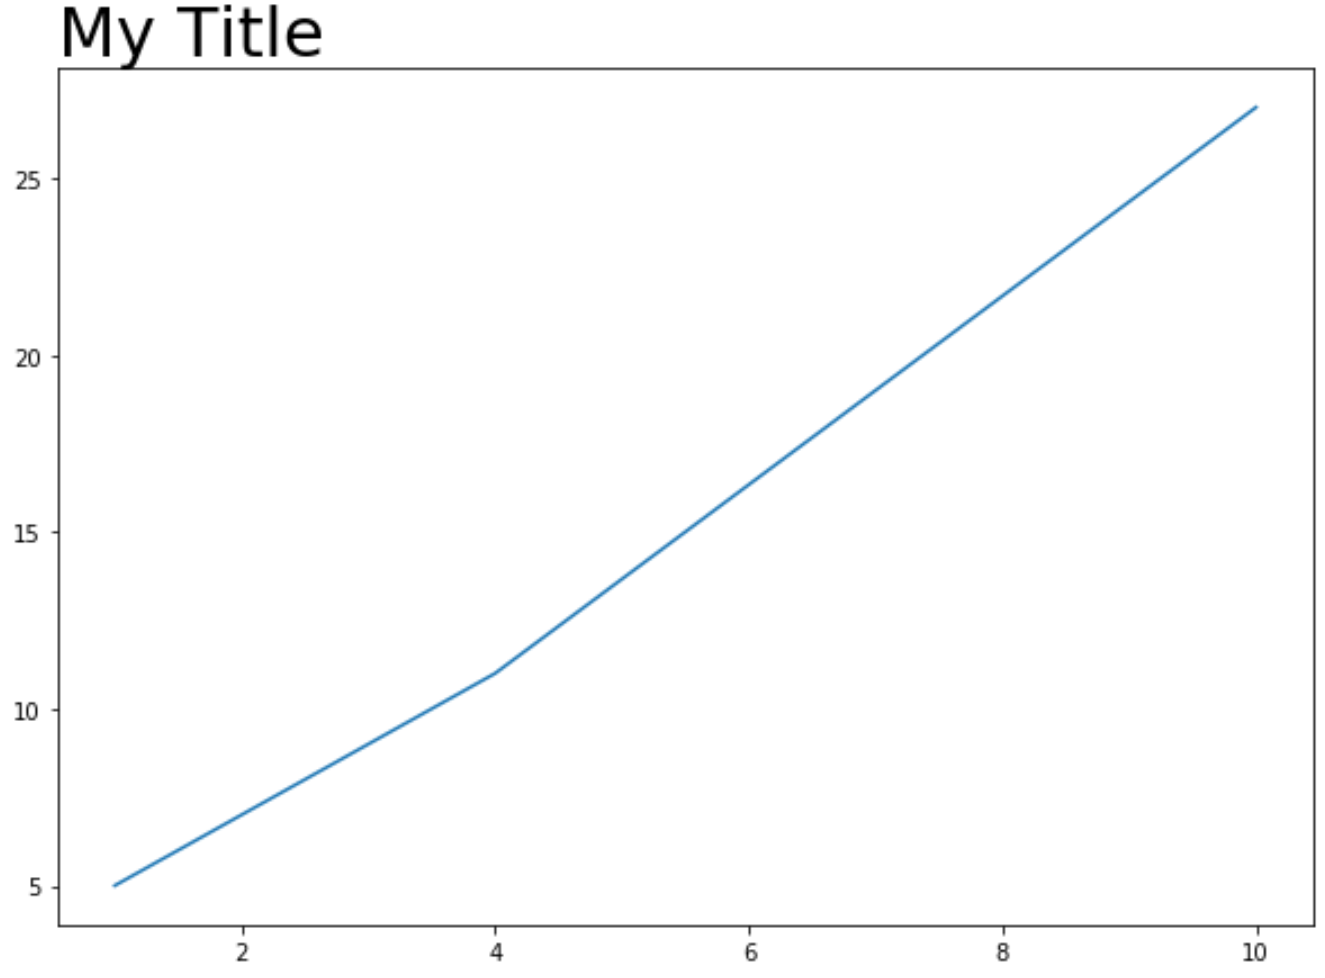
Note that you can also use the fontsize and loc arguments to specify the font size and location of the title, respectively:
plt.title('My Title', fontsize=30, loc='left')
Example 2: Add Title to Subplots
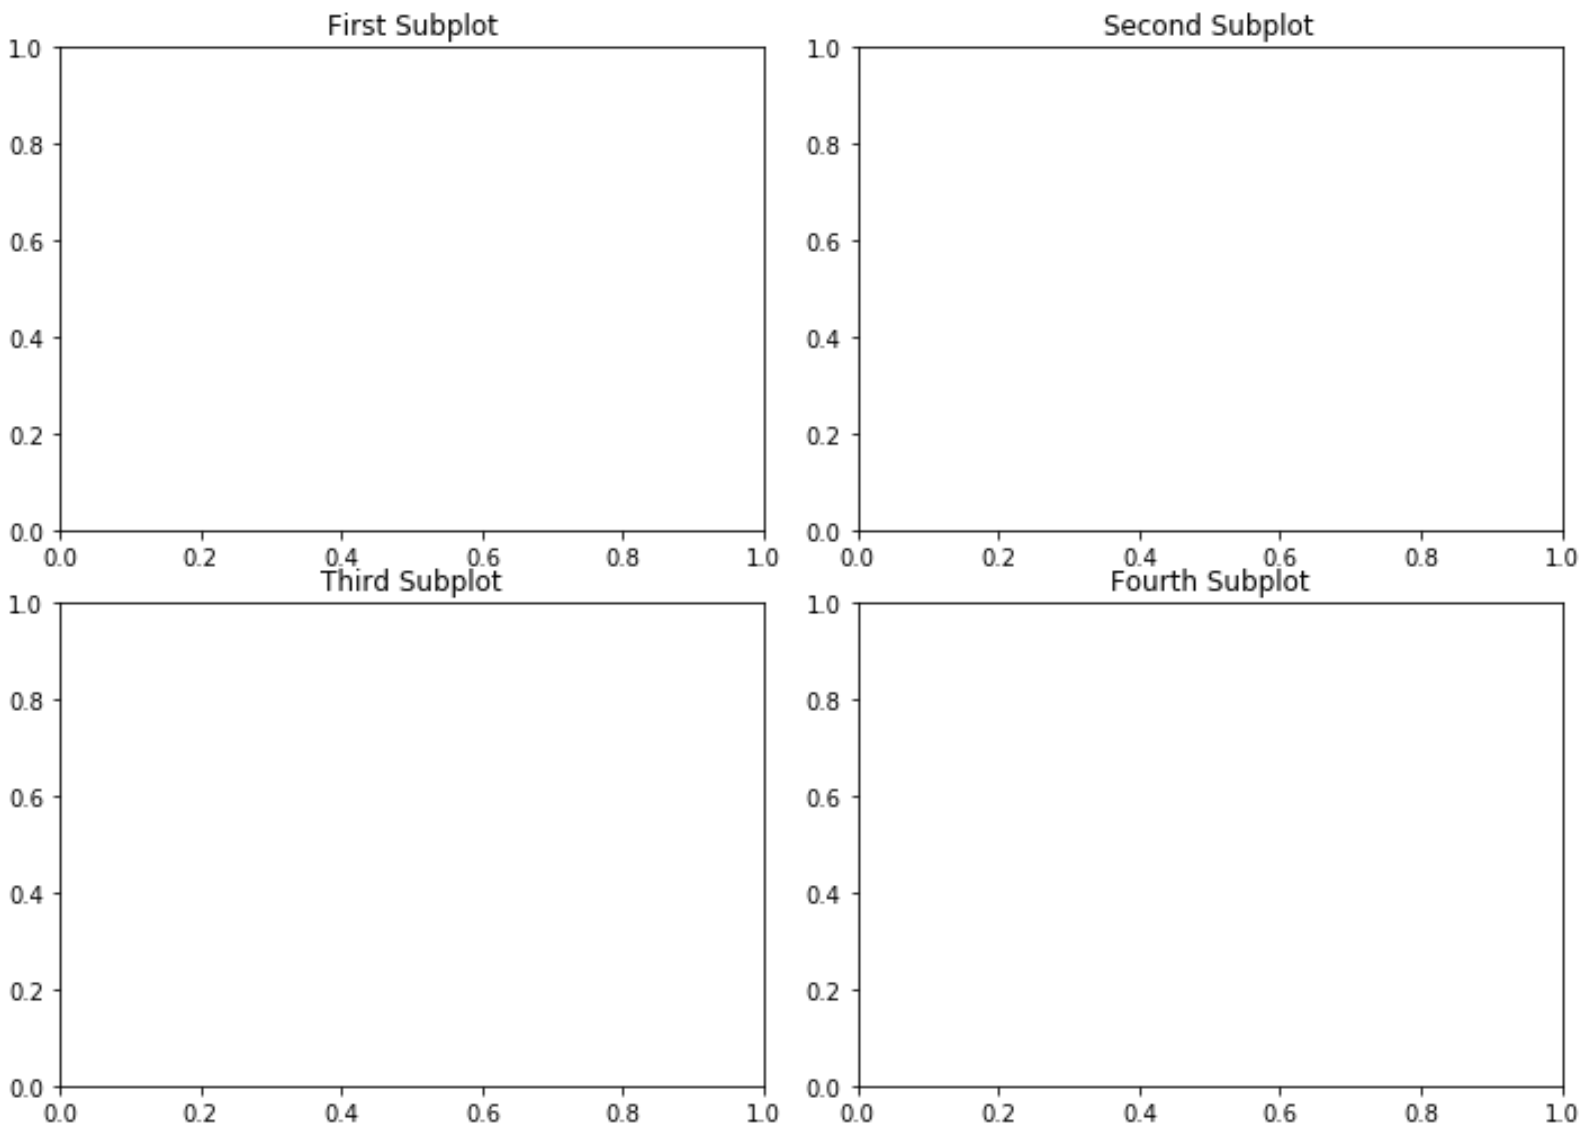
The following code shows how to use the set_title() function to specify titles for individual subplots in Matplotlib:
import matplotlib.pyplot as plt

#define subplots
fig, ax = plt.subplots(2, 2)
fig.tight_layout()

#define subplot titles
ax[0, 0].set_title('First Subplot')
ax[0, 1].set_title('Second Subplot')
ax[1, 0].set_title('Third Subplot')
ax[1, 1].set_title('Fourth Subplot')
Additional Resources
How to Increase Plot Size in Matplotlib
How to Adjust Title Position in Matplotlib
How to Add Text to Matplotlib Plots
How to Set Axis Ranges in Matplotlib