The most common way to compare the means between two independent groups is to use a two-sample t-test. However, this test assumes that the variances between the two groups is equal.
If you suspect that the variance between the two groups is not equal, then you can instead use Welch’s t-test, which is the non-parametric equivalent of the two-sample t-test.
This tutorial explains how to perform Welch’s t-test in Excel.
Example: Welch’s t-test in Excel
For this example we will compare the exam scores of 12 students who used an exam prep booklet to prepare for the exam vs. 12 students who did not.
Use the following steps to perform a Welch’t t-test to determine if there is a difference in the mean exam scores between the two groups.
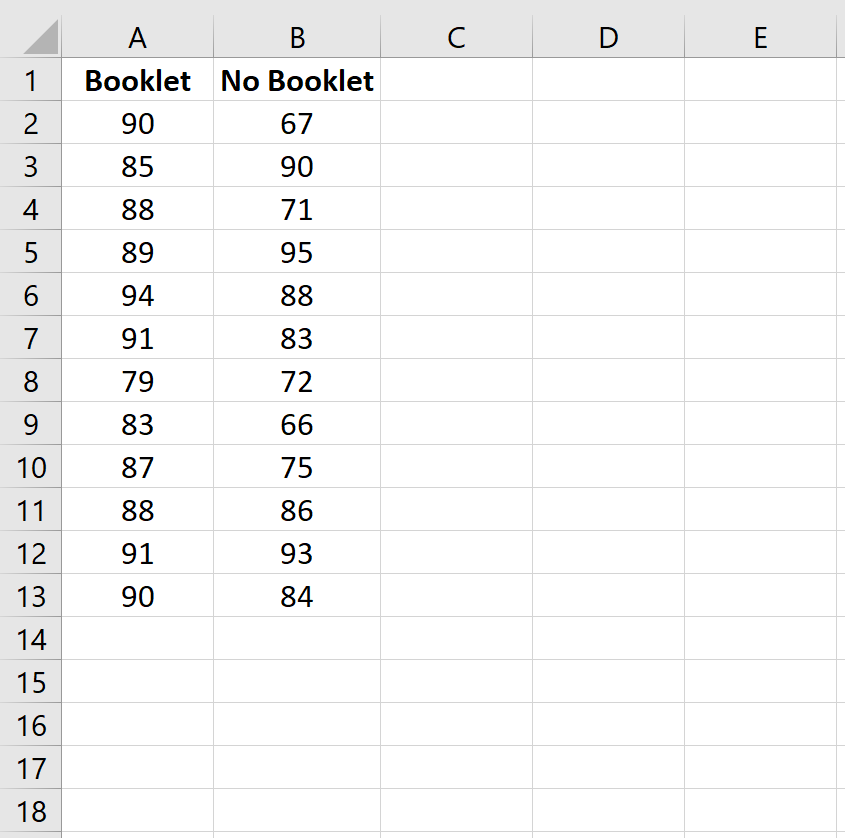
Step 1: Enter the data.
First, enter the exam scores into two columns:
Step 2: Perform Welch’s t-test.
Along the top ribbon in Excel, go to the Data tab and click on Data Analysis. If you don’t see this option, then you need to first install the free Analysis ToolPak.

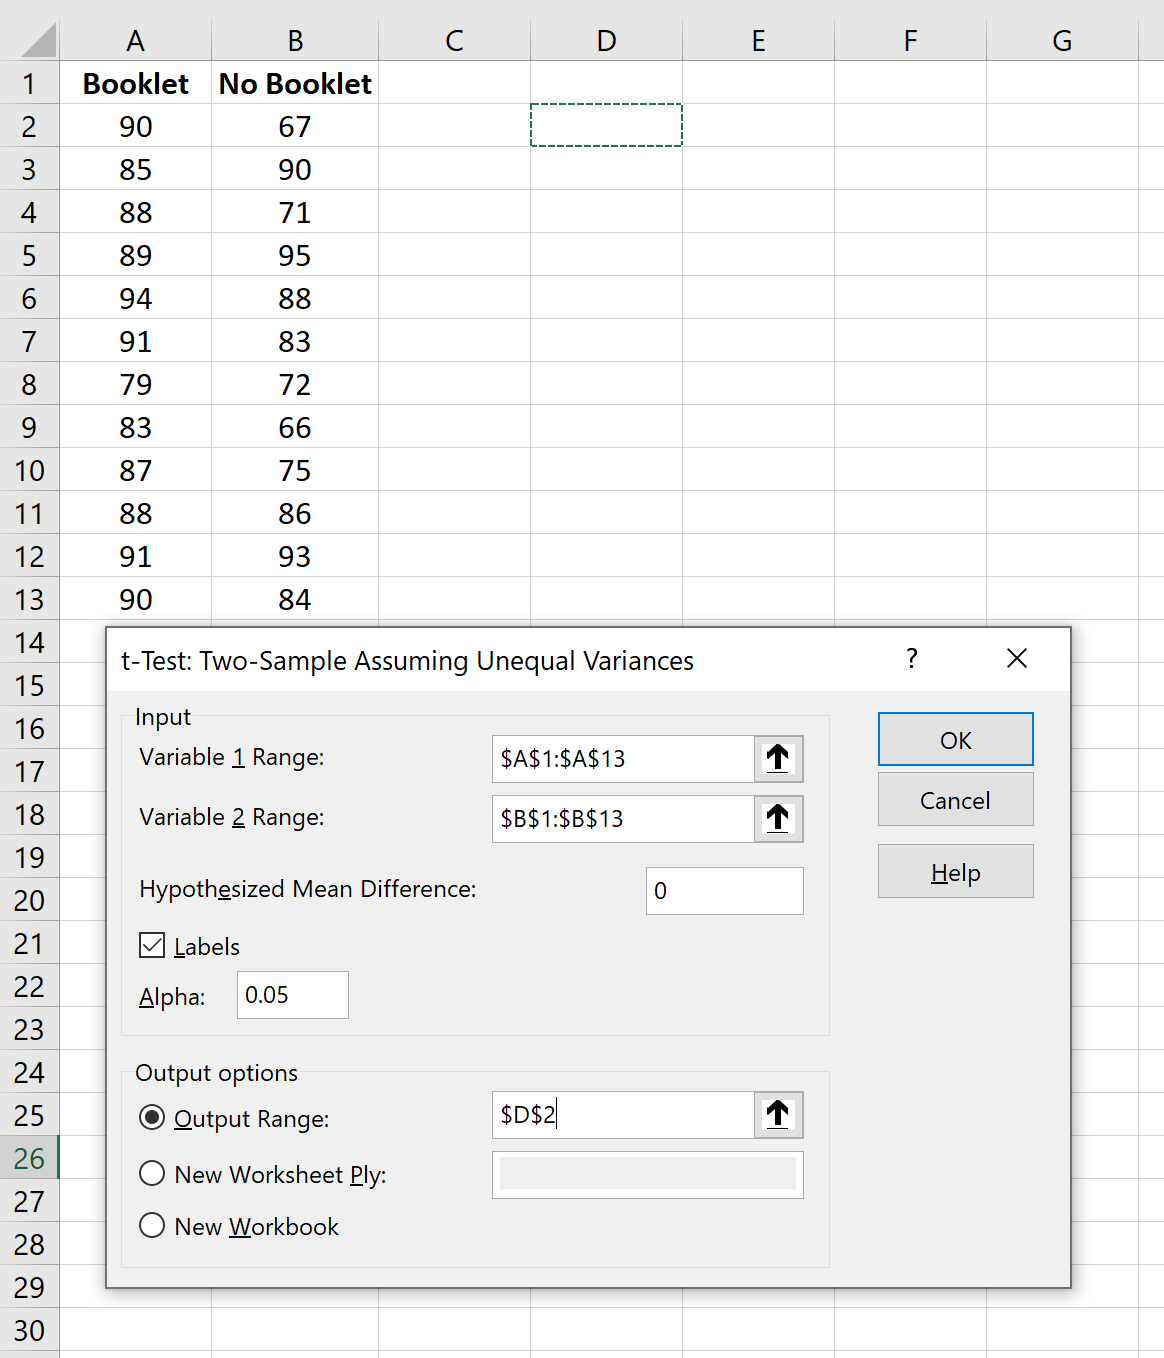
Once you click on Data Analysis, a new window will pop up. Select t-Test: Two-Sample Assuming Unequal Variances and click OK.
In the new window, type in the range of data values for both Variable 1 and Variable 2, including their group labels. For Hypothesized Mean Difference, type 0. Check the box next to Labels. Leave Alpha set to 0.05. For Output Range, choose a cell where you’d like the results of the test to appear. Then click OK.
The following output automatically appears:
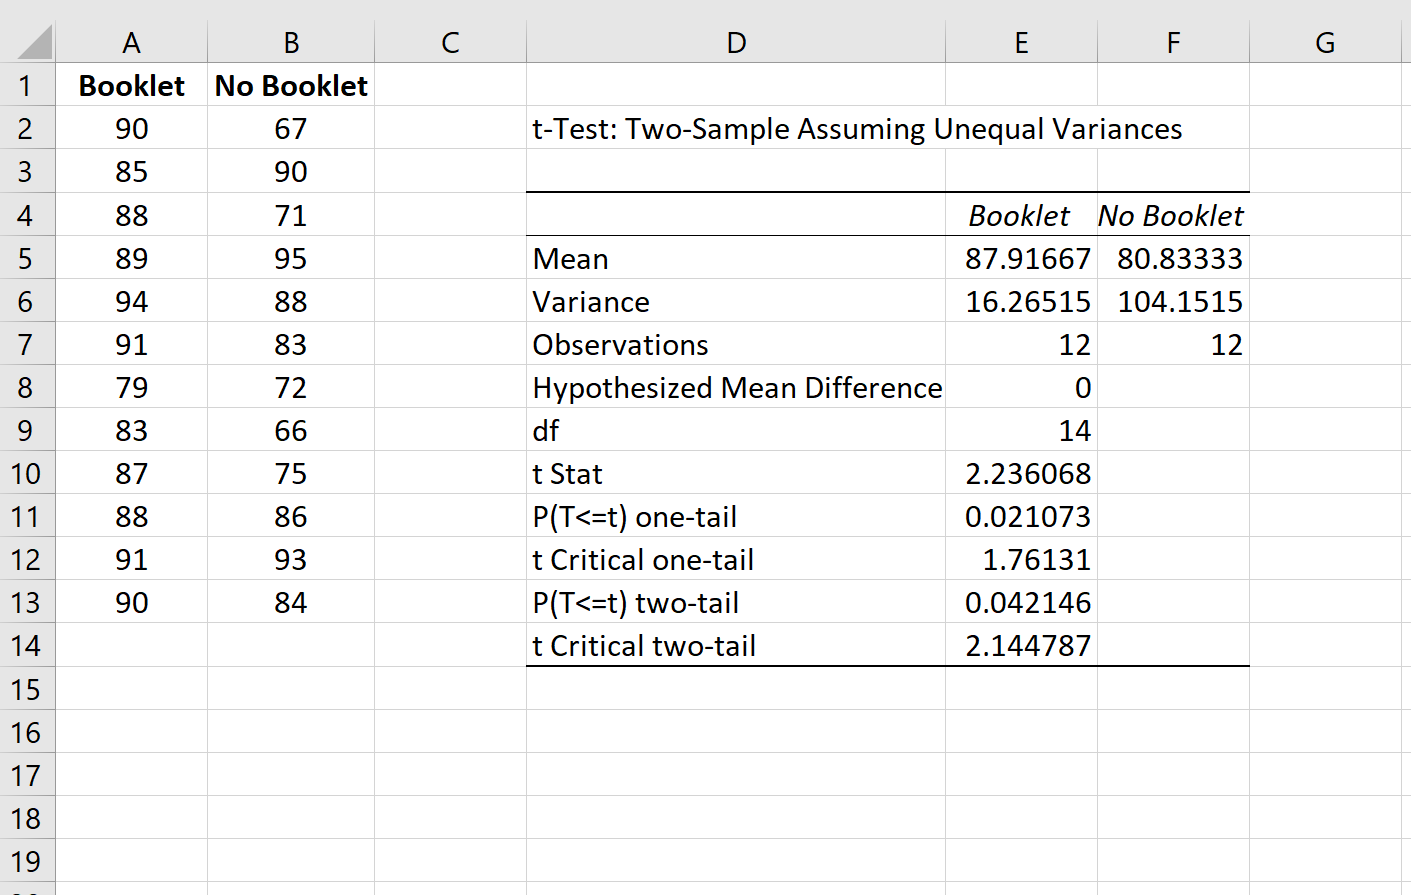
Here is how to interpret the output:
- Mean: The mean exam score for each group.
- Variance: The variance of exam scores for each group.
- Observations: The sample size for each group.
- Hypothesized Mean Difference: The mean difference to use in the null hypothesis of the test.
- df: The degrees of freedom to be used with the test statistic, calculated as n1 + n2 – 2.
- t Stat: The test statistic for the test.
- P(TThe p-value associated with the test statistic for a one-tailed test. Ignore this since we’re conducting a two-tailed test.
- P(TThe p-value associated with the test statistic for a two-tailed test. Since this is less than 0.05, we would reject the null hypothesis and conclude that the mean exam score between the two groups is statistically significantly different at the level α = 0.05.
Step 3: Report the results.
Lastly, we want to report the results of our Welch’s t-test. Here is an example of how to do so:
A Welch’s t-test was performed to determine if there was a statistically significant difference in exam scores between a group of students that used an exam prep booklet to prepare for the exam vs. a group that did not. The sample size for both groups was 12 students.
A Welch’s t-test revealed that there was a statistically significant difference in mean exam scores (t = 2.236, p = 0.0421) between the two groups.