A one-way ANOVA is used to determine whether or not there is a statistically significant difference between the means of three or more independent groups.
If the overall p-value from the ANOVA table is less than some significance level, then we have sufficient evidence to say that at least one of the means of the groups is different from the others.
However, this doesn’t tell us which groups are different from each other. It simply tells us that not all of the group means are equal.
In order to find out exactly which groups are different from each other, we must conduct a post-hoc test that is capable of controlling the family-wise error rate.
One of the most commonly used post hoc tests is Scheffe’s test.
The following step-by-step example shows how to perform Scheffe’s test in Excel.
Step 1: Enter the Data
Suppose a teacher wants to know whether or not three different studying techniques lead to different exam scores among students. To test this, she randomly assigns 10 students to use each studying technique and records their exam scores.
First, we’ll enter the grades for each student based on their studying technique used:

Step 2: Perform a One-Way ANOVA
To perform a one-way ANOVA, click the Data tab along the top ribbon, then click on the Data Analysis option within the Analysis group.

If you don’t see this option, you need to first load the Analysis ToolPak.
In the new window that appears, click Anova: Single Factor and then click OK.
In the new window that appears, fill in the following information:
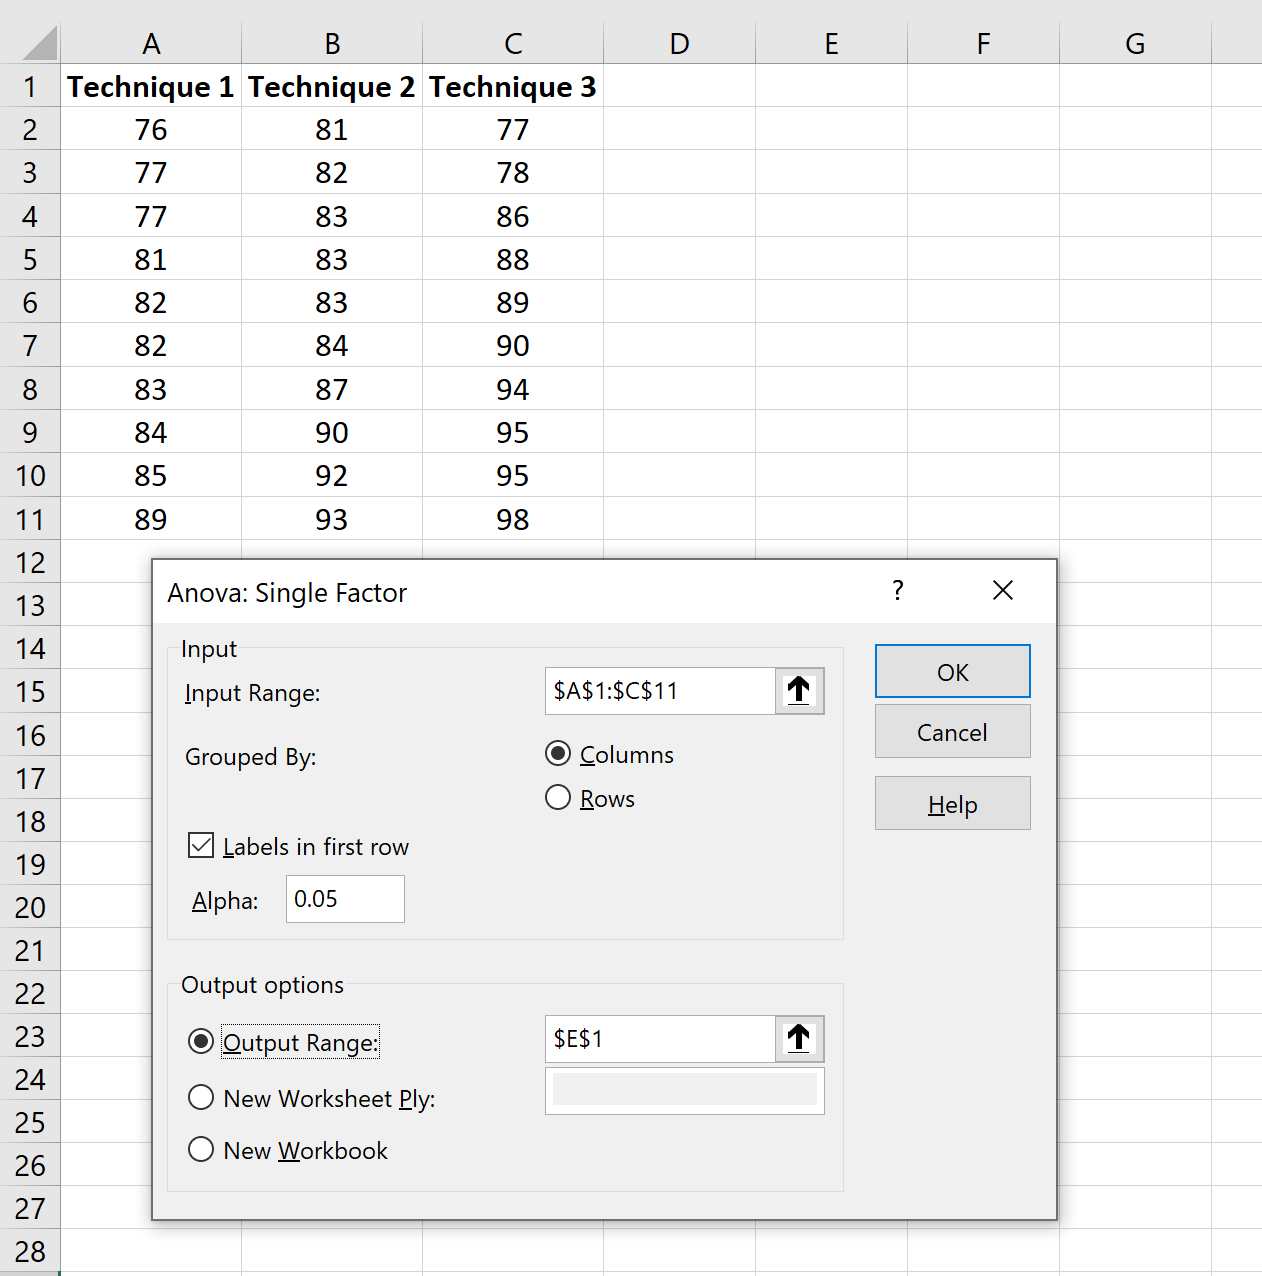
Once you click OK, the results of the one-way ANOVA will appear:
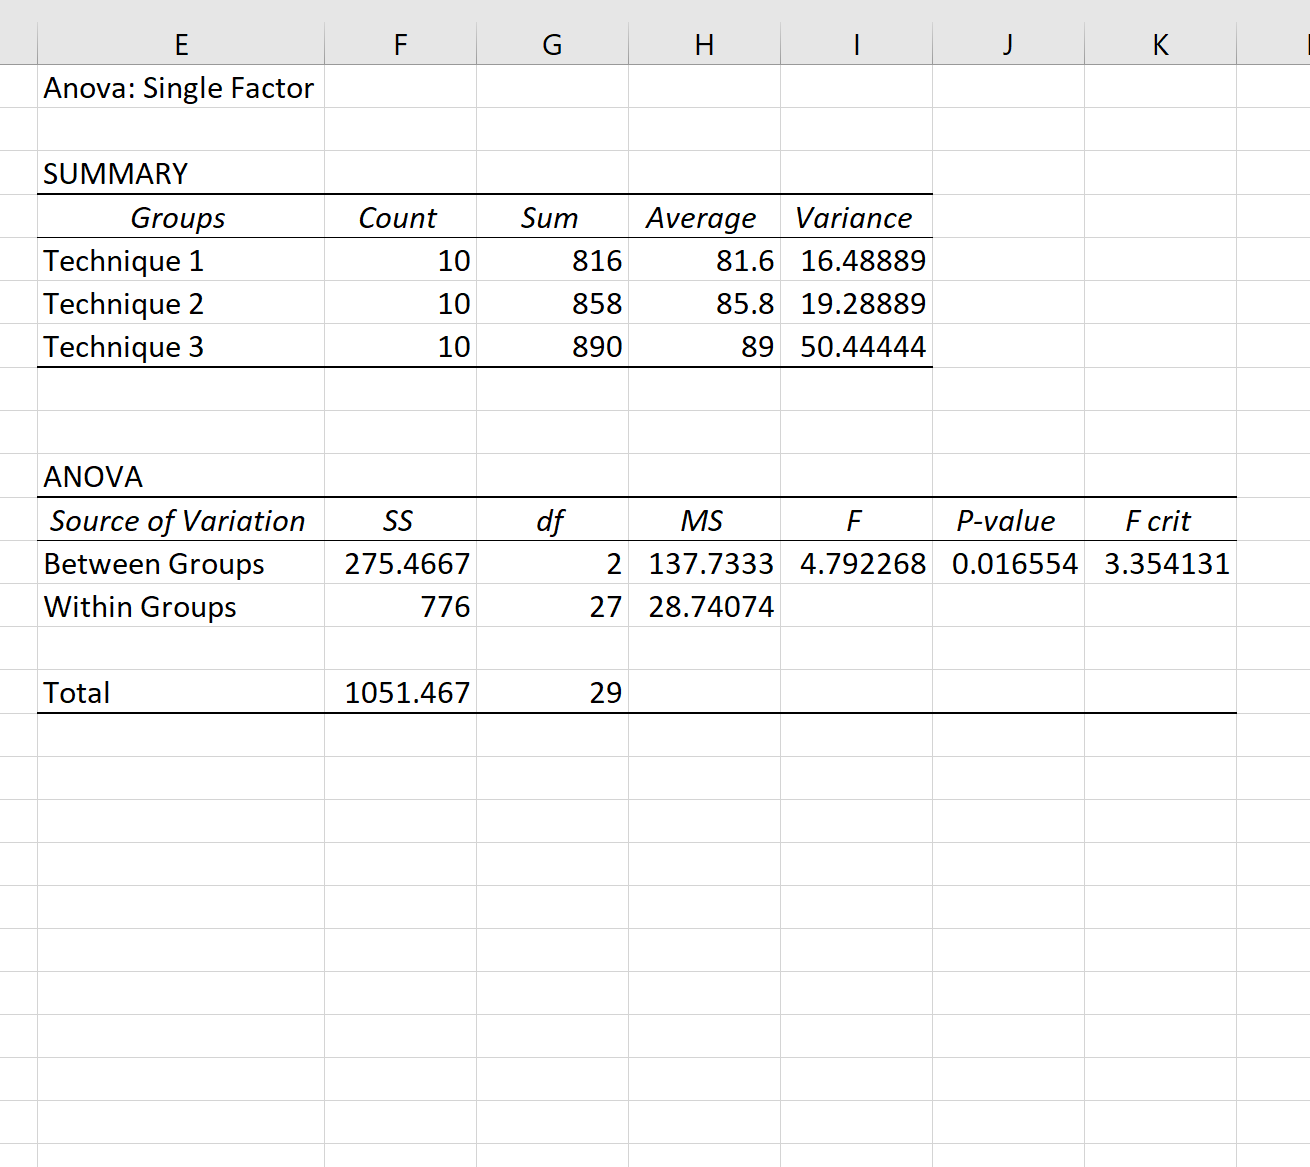
Since the overall p-value (0.016554) in the ANOVA table is less than .05, this means that each group does not have the same average exam score.
Next, we will perform Scheffe’s test to determine which groups are different.
Step 3: Perform Scheffe’s Test
First, we need to calculate Scheffe’s critical value. This is calculated as:
Scheffe’s Critical Value = F Critical Value * 2
In our example, Scheffe’s critical value is 3.354131 * 2 = 6.708.
Next, we can calculate the F-statistic for each pairwise comparison, which is calculated as:
F-statistic: (x1–x2)2 / (MSwithin(1/n1 + 1/n2))
For example, we can use the following formulas to calculate the F-statistic for the pairwise difference between each technique:
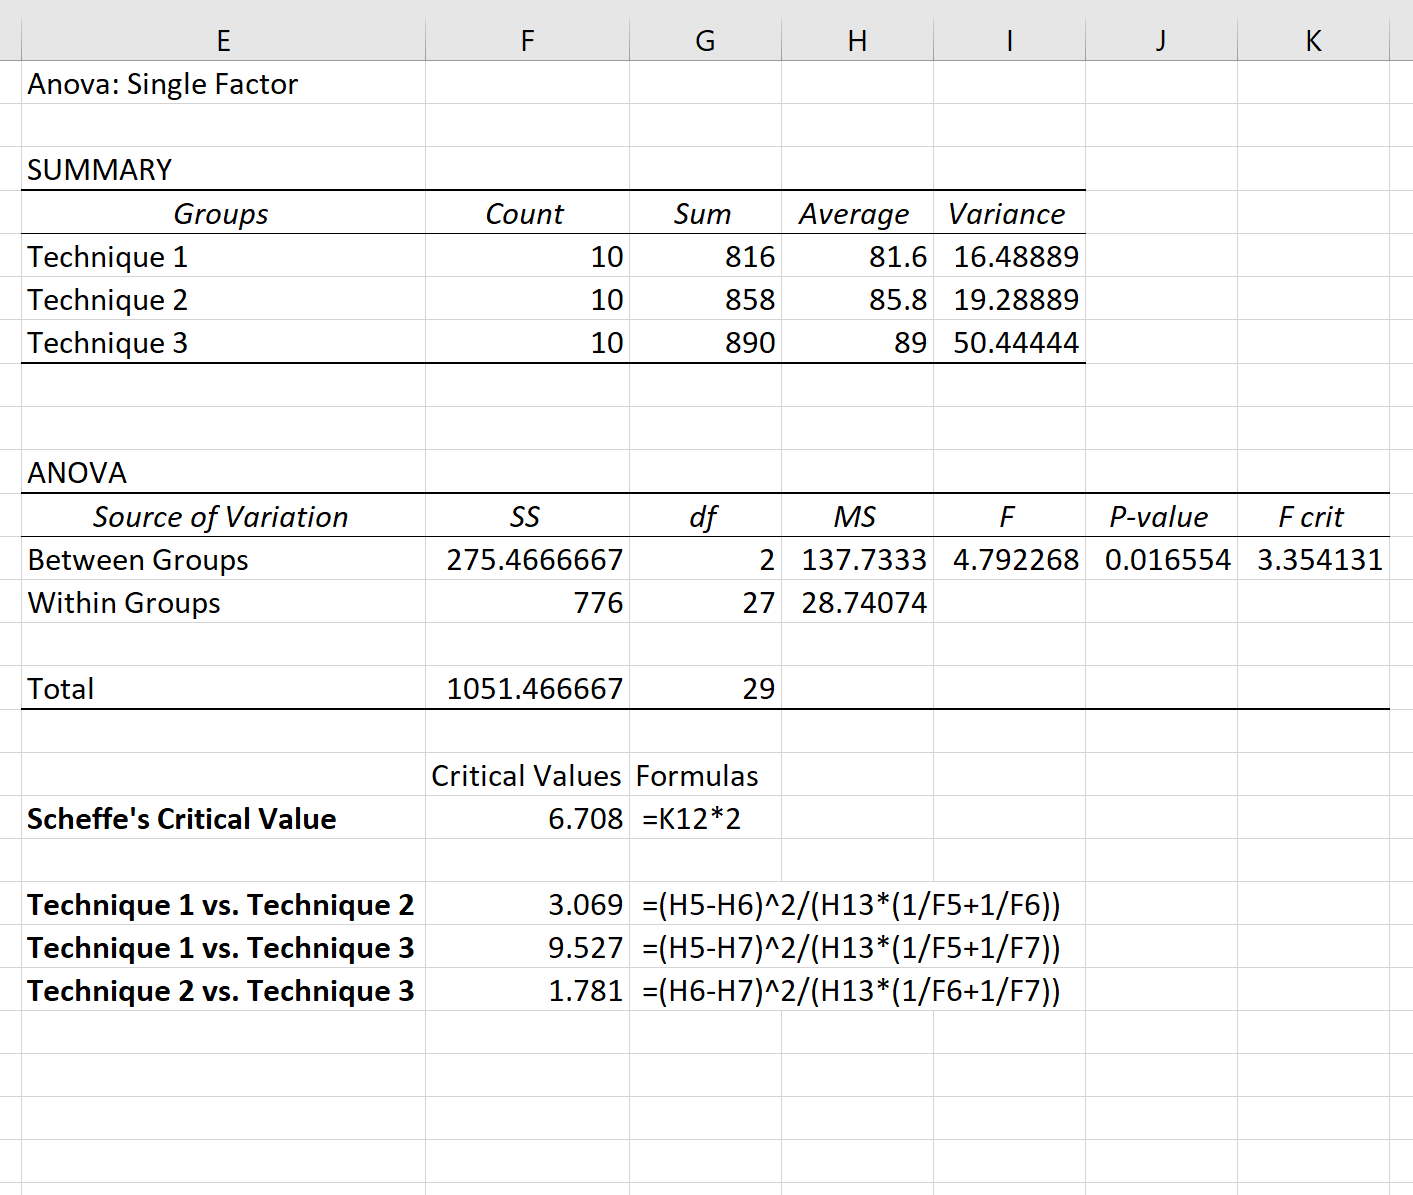
The only F-statistic that exceeds Scheffe’s Critical Value is the one for the comparison between technique 1 and technique 3.
Thus, the only two groups that are statistically significantly different are technique 1 and technique 3.
Additional Resources
How to Perform a One-Way ANOVA in Excel
How to Perform a Two-Way ANOVA in Excel
How to Perform a Tukey-Kramer Post Hoc Test in Excel