You can use the following syntax to draw a vertical line in Matplotlib:
import matplotlib.pyplot as plt

#draw vertical line at x=2
plt.axvline(x=2)
The following examples show how to use this syntax in practice with the following pandas DataFrame:
import pandas as pd

#create DataFrame
df = pd.DataFrame({'x': [1, 2, 3, 4, 5, 6, 7, 8],
                   'y': [5, 7, 8, 15, 26, 39, 45, 40]})

#view DataFrame
df

	x	y
0	1	5
1	2	7
2	3	8
3	4	15
4	5	26
5	6	39
6	7	45
7	8	40
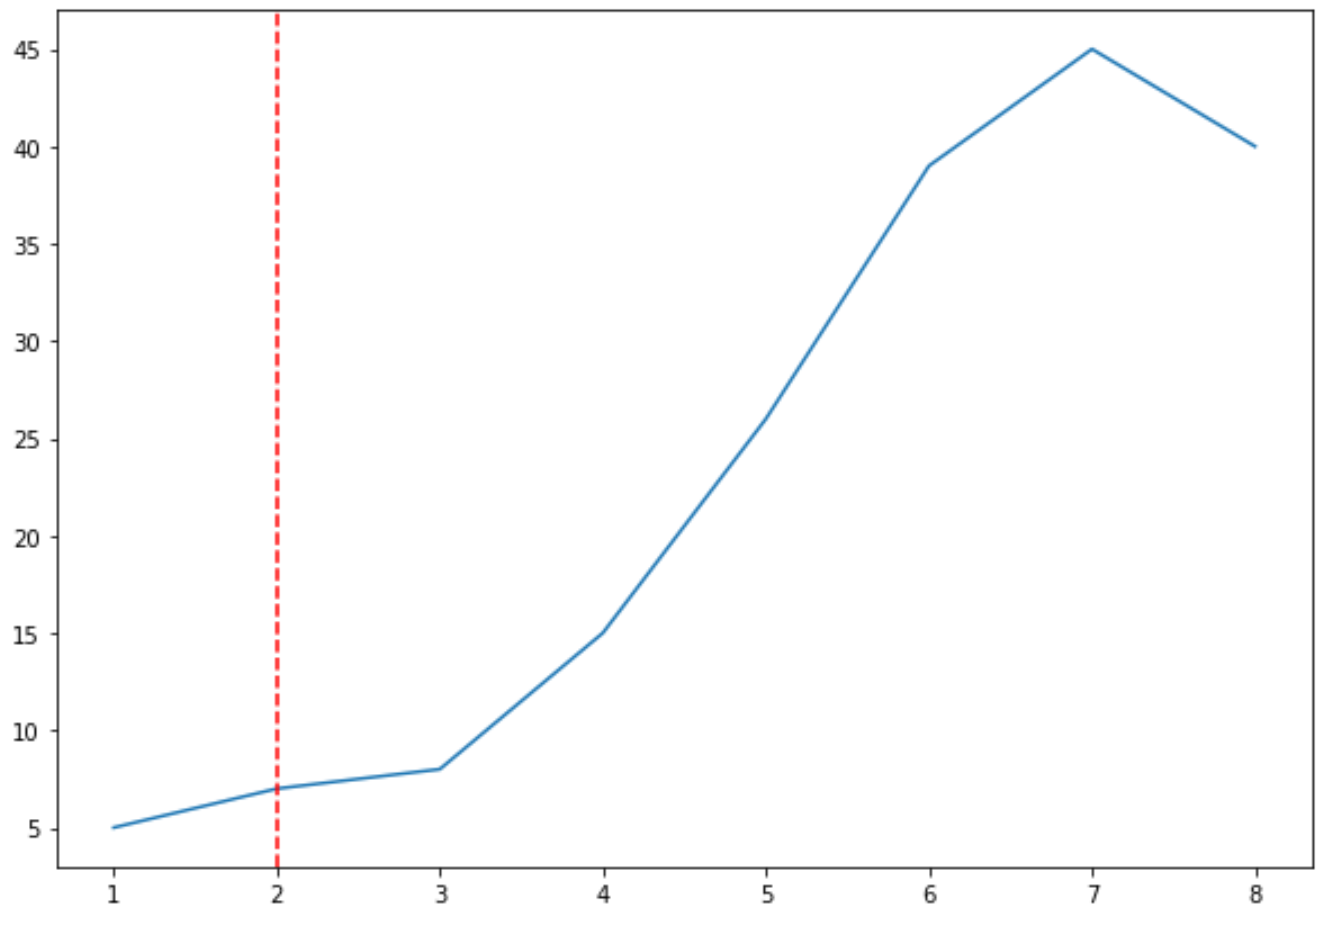
Example 1: Draw One Vertical Line
The following code shows how to draw one vertical line on a Matplotlib plot:
import matplotlib.pyplot as plt

#create line plot
plt.plot(df.x, df.y)

#add vertical line at x=2
plt.axvline(x=2, color='red', linestyle='--')
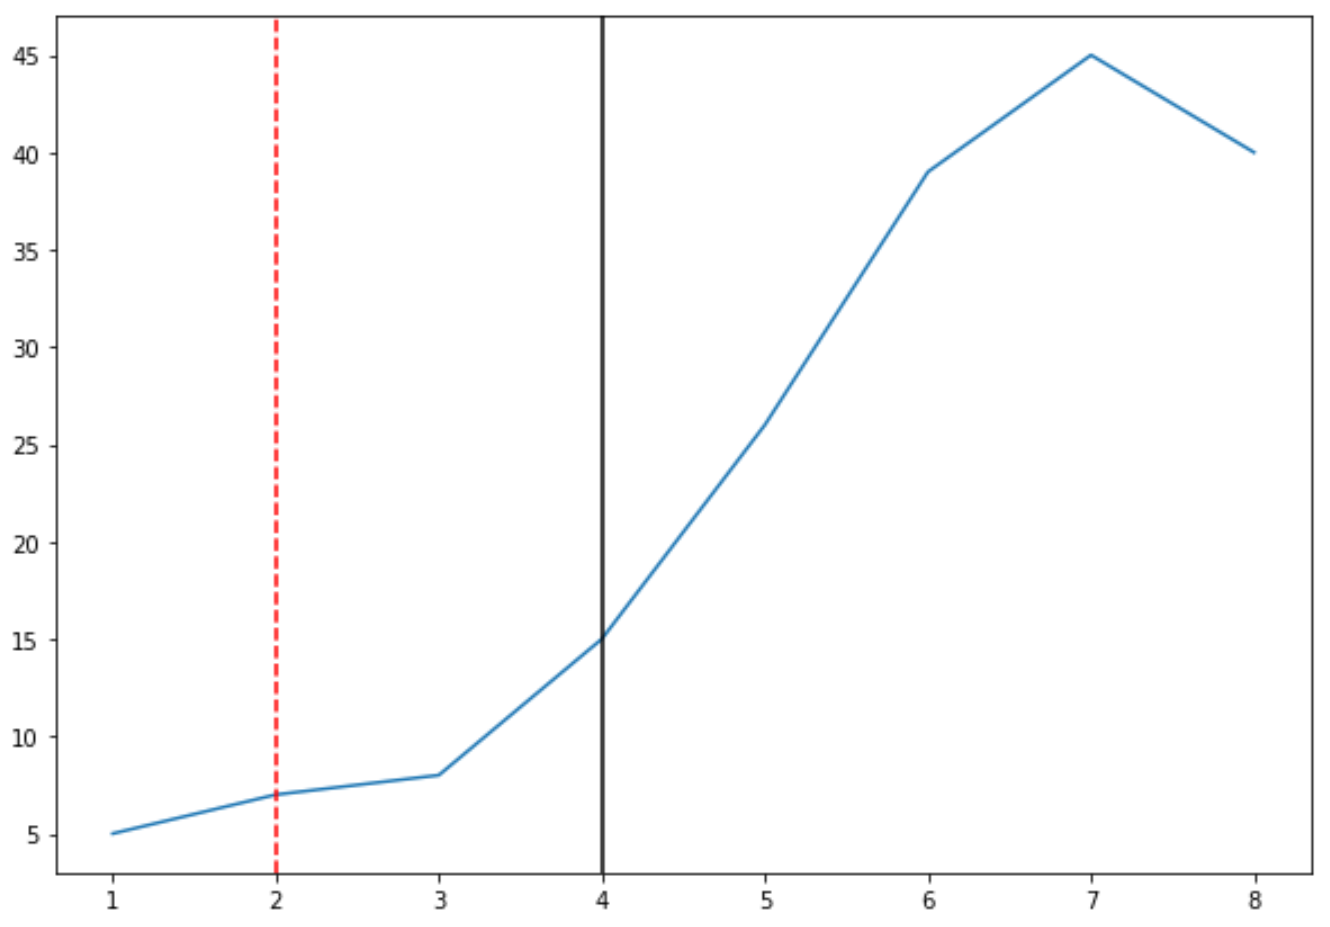
Example 2: Draw Multiple Vertical Lines
The following code shows how to draw multiple vertical lines on a Matplotlib plot:
import matplotlib.pyplot as plt

#create line plot
plt.plot(df.x, df.y)

#add vertical line at x=2
plt.axvline(x=2, color='red', linestyle='--')

#add vertical line at x=4
plt.axvline(x=4, color='black', linestyle='-')
Example 3: Draw Multiple Vertical Lines with Legend
The following code shows how to draw multiple vertical lines on a Matplotlib plot and add a legend to make the lines easier to interpret:
import matplotlib.pyplot as plt

#create line plot
plt.plot(df.x, df.y)

#add vertical line at x=2
plt.axvline(x=2, color='red', linestyle='--', label='First Line')

#add vertical line at x=4
plt.axvline(x=4, color='black', linestyle='-', label='Second Line')

#add legend
plt.legend()
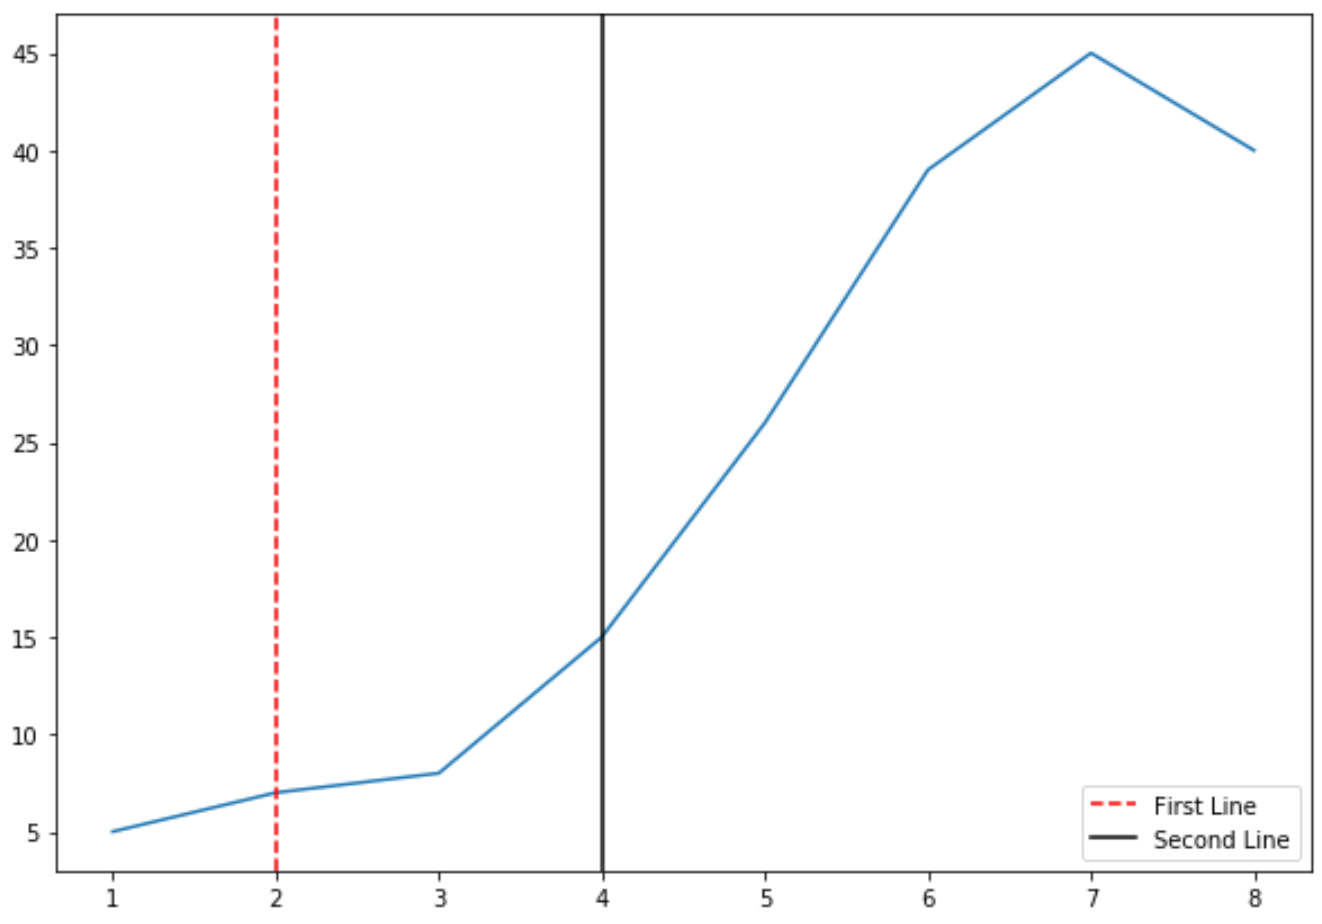
Note: Refer to the Matplotlib documentation for a list of potential colors and linestyles you can apply to vertical lines.
Additional Resources
How to Draw a Horizontal Line in Matplotlib
How to Plot Multiple Lines in Matplotlib
How to Plot a Time Series in Matplotlib
How to Draw Rectangles in Matplotlib
How to Draw Arrows in Matplotlib