You can use the LINEST function to quickly find a regression equation in Excel.
This function uses the following basic syntax:
LINEST(known_y's, known_x's)
where:
- known_y’s: A column of values for the response variable
- known_x’s: One or more columns of values for the predictor variables
The following examples show how to use this function to find a regression equation for a simple linear regression model and a multiple linear regression model.
Example 1: Find Equation for Simple Linear Regression
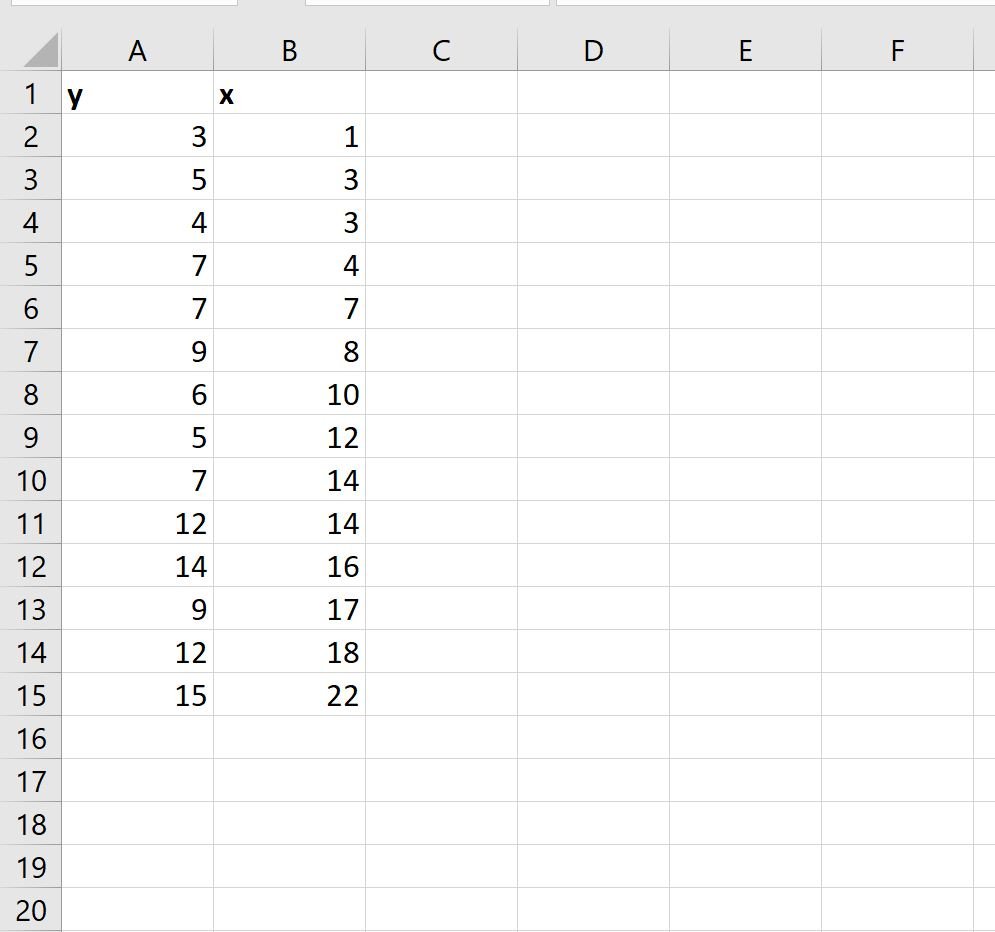
Suppose we have the following dataset that contains one predictor variable (x) and one response variable (y):
We can type the following formula into cell D1 to calculate the simple linear regression equation for this dataset:
=LINEST(A2:A15, B2:B15)
Once we press ENTER, the coefficients for the simple linear regression model will be shown:
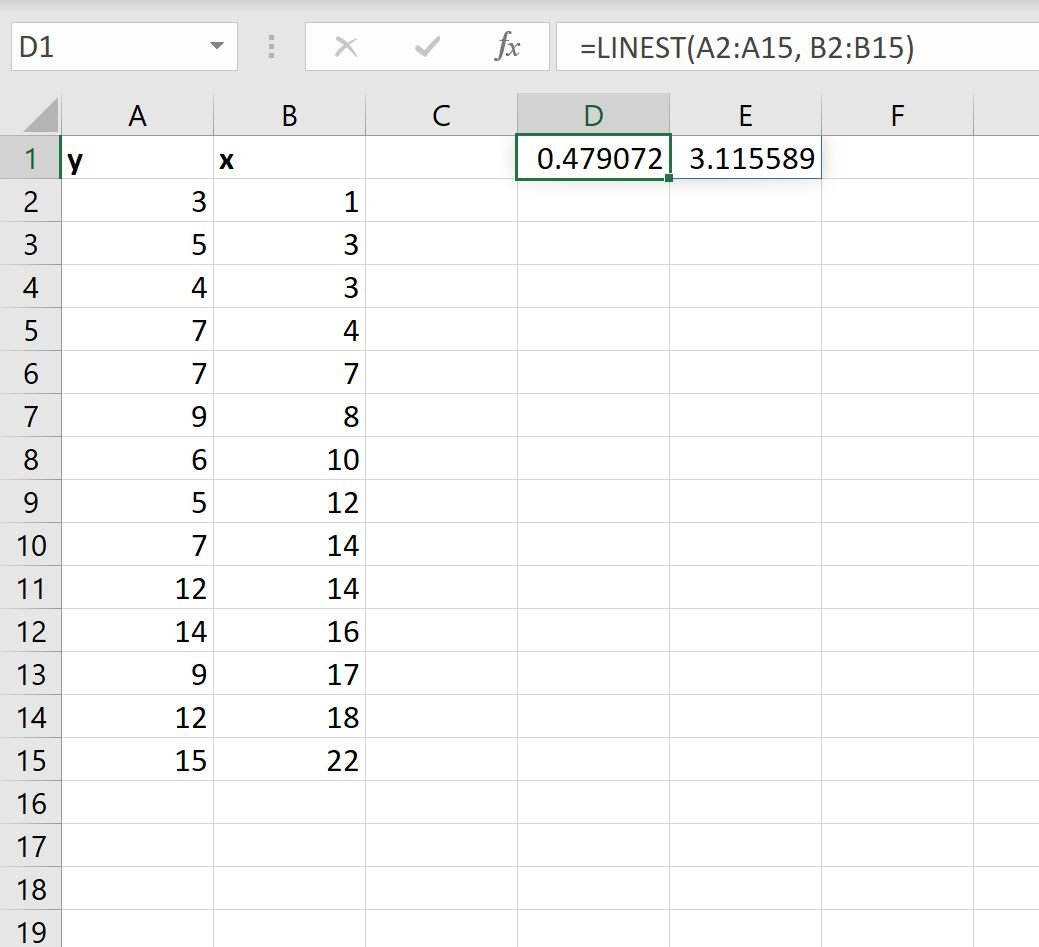
Here’s how to interpret the output:
- The coefficient for the intercept is 3.115589
- The coefficient for the slope is 0.479072
Using these values, we can write the equation for this simple regression model:
y = 3.115589 + 0.478072(x)
Note: To find the p-values for the coefficients, the r-squared value of the model, and other metrics, you should use the Regression function from the Data Analysis ToolPak. This tutorial explains how to do so.
Example 2: Find Equation for Multiple Linear Regression
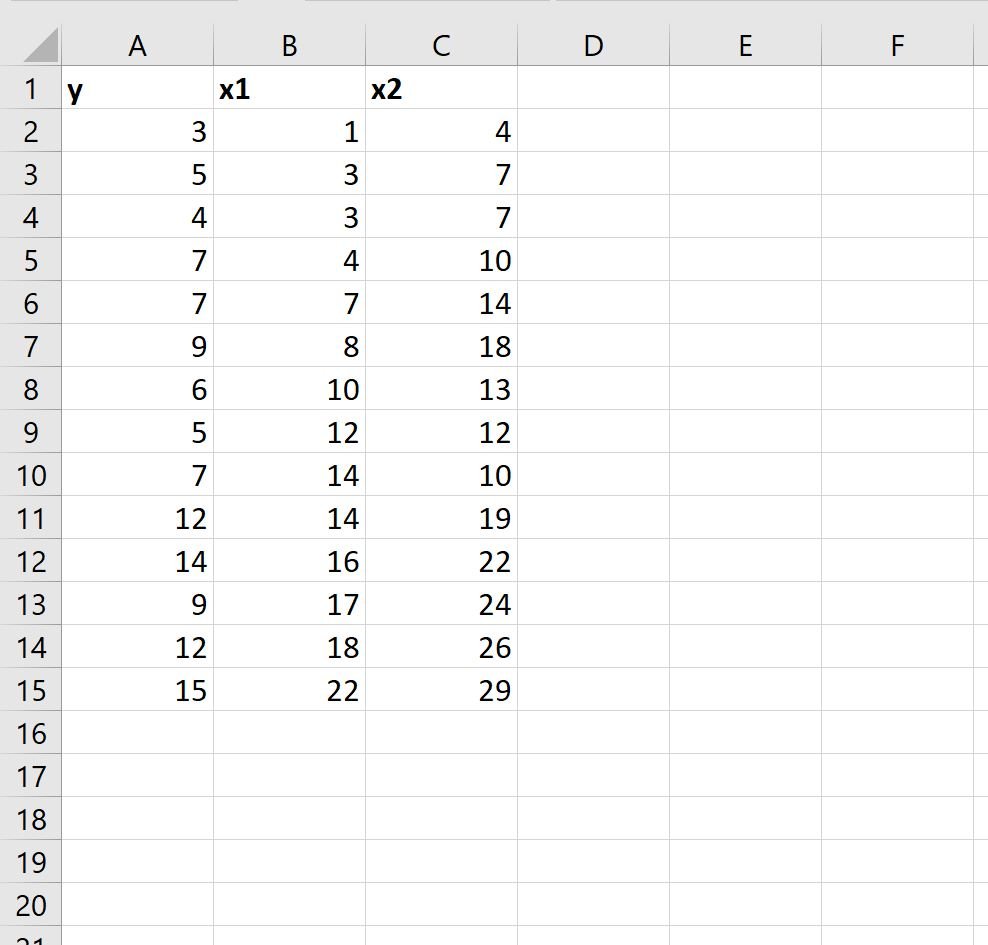
Suppose we have the following dataset that contains two predictor variables (x1 and x2) and one response variable (y):
We can type the following formula into cell E1 to calculate the multiple linear regression equation for this dataset:
=LINEST(A2:A15, B2:C15)
Once we press ENTER, the coefficients for the multiple linear regression model will be shown:
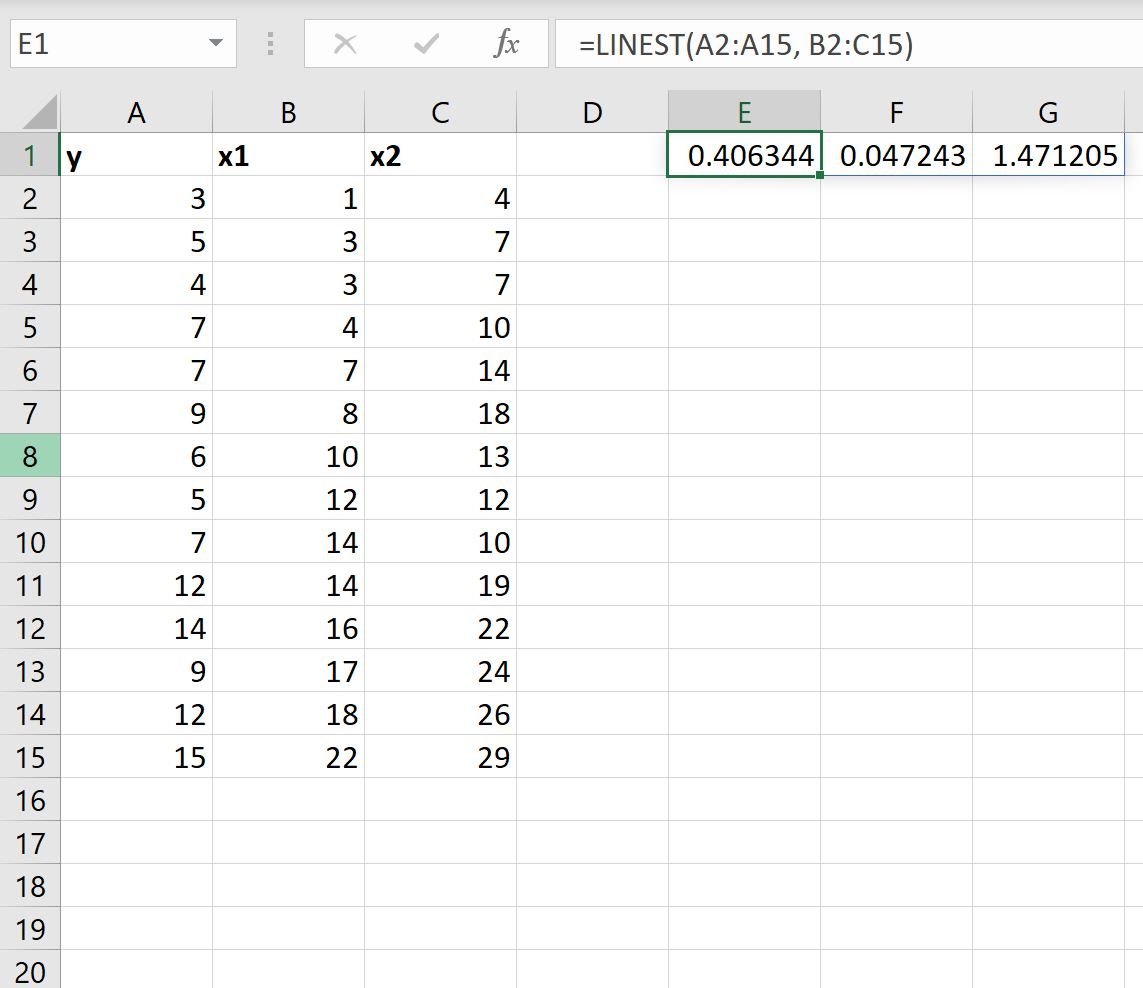
Here’s how to interpret the output:
- The coefficient for the intercept is 1.471205
- The coefficient for x1 is 0.047243
- The coefficient for x2 is 0.406344
Using these values, we can write the equation for this multiple regression model:
y = 1.471205 + 0.047243(x1) + 0.406344(x2)
Note: To find the p-values for the coefficients, the r-squared value of the model, and other metrics for a multiple linear regression model in Excel, you should use the Regression function from the Data Analysis ToolPak. This tutorial explains how to do so.
Additional Resources
The following tutorials provide additional information on regression in Excel:
How to Interpret Regression Output in Excel
How to Add a Regression Line to a Scatterplot in Excel
How to Perform Polynomial Regression in Excel