Explained variance (sometimes called “explained variation”) refers to the variance in the response variable in a model that can be explained by the predictor variable(s) in the model.
The higher the explained variance of a model, the more the model is able to explain the variation in the data.
Explained variance appears in the output of two different statistical models:
1. ANOVA: Used to compare the means of three or more independent groups.
2. Regression: Used to quantify the relationship between one or more predictor variables and a response variable.
The following examples show how to interpret residual variance in each of these methods.
Note: The opposite of explained variance is known as residual variance.
Explained Variance in ANOVA Models
Whenever we fit an ANOVA (“analysis of variance”) model, we end up with an ANOVA table that looks like the following:
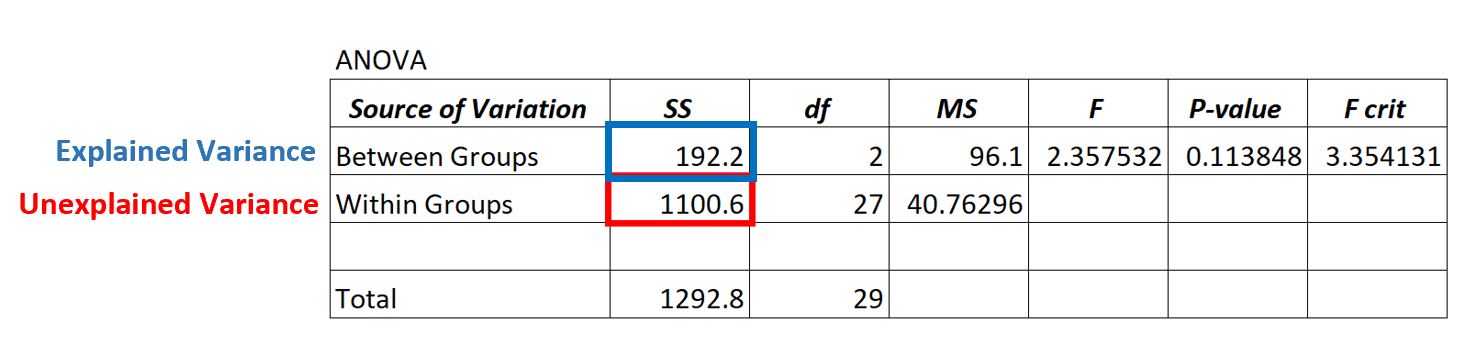
The explained variance can be found in the SS (“sum of squares”) column for the Between Groups variation.
In the ANOVA model above we see that the explained variance is 192.2.
To determine if this explained variance is “high” we can calculate the mean sum of squared for within groups and mean sum of squared for between groups and find the ratio between the two, which results in the overall F-value in the ANOVA table.
- F = MSbetween / MSwithin
- F = 96.1 / 40.76296
- F = 2.357
The F-value in the ANOVA table above is 2.357 and the corresponding p-value is 0.113848.
Since this p-value is not less than α = .05, we do not have sufficient evidence to reject the null hypothesis of the ANOVA.
This means we don’t have sufficient evidence to say that the mean difference between the groups we’re comparing is significantly different.
This tells us that the explained variance in the ANOVA model is low relative to the unexplained variance.
Explained Variance in Regression Models
In a regression model, the explained variance is summarized by R-squared, often written R2.
This value represents the proportion of the variance in the response variable that can be explained by the predictor variable(s) in the model.
The value for R-squared can range from 0 to where:
- A value of 0 indicates that the response variable cannot be explained by the predictor variable(s) at all.
- A value of 1 indicates that the response variable can be perfectly explained without error by the predictor variable(s).
When we fit a regression model, we typically end up with output that looks like the following:
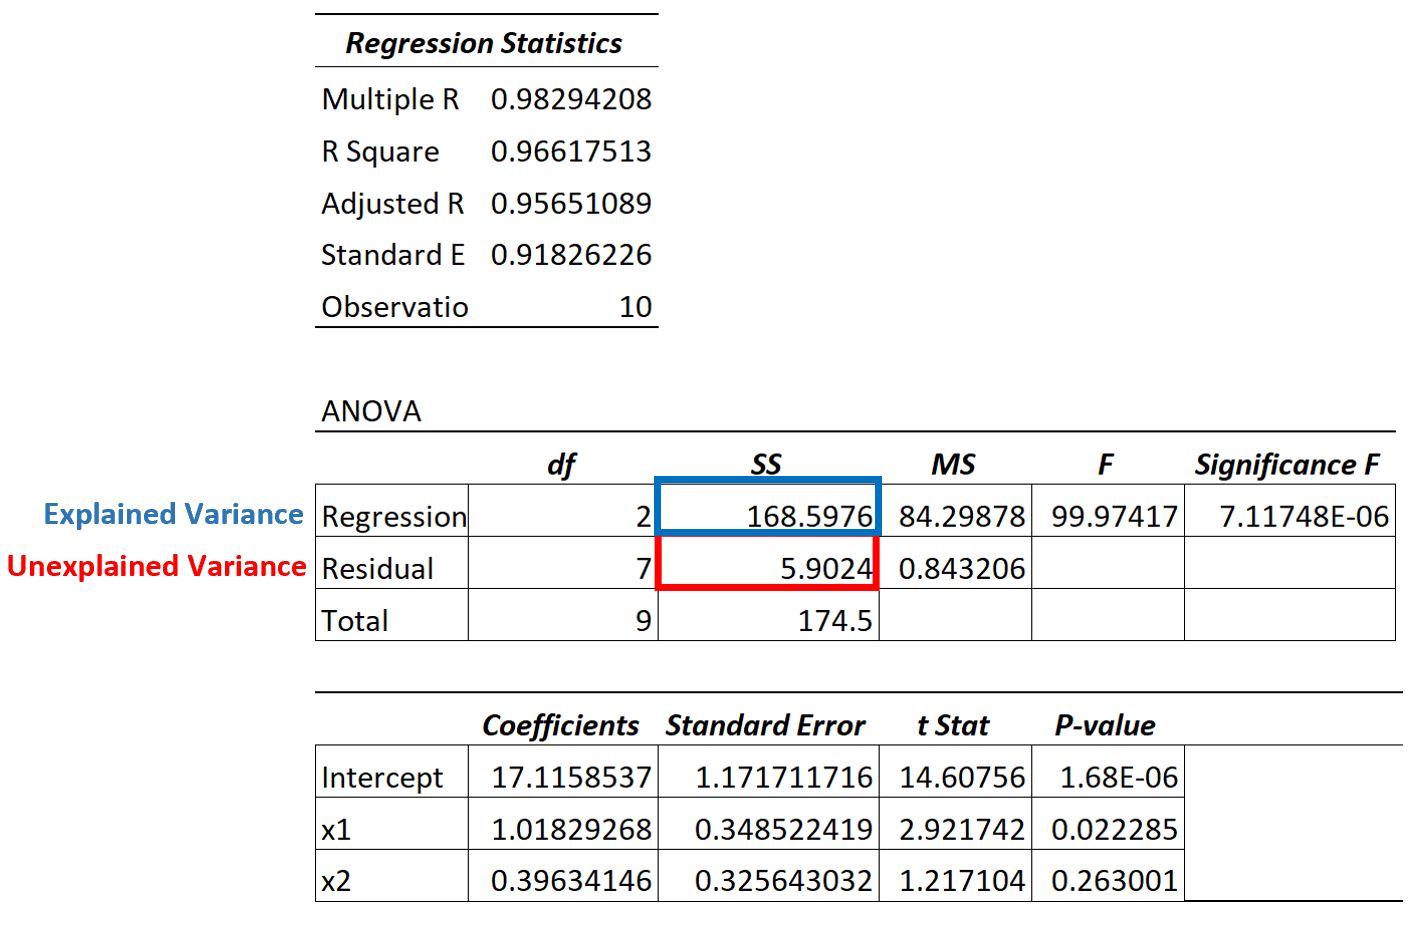
We can see that the explained variance is 168.5976 and the total variance is 174.5.
Using these values, we can calculate the R-squared value for this regression model as:
- R-squared: SS Regression / SS Total
- R-squared: 168.5976 / 174.5
- R-squared: 0.966
Since the R-squared value for this model is close to 1, it tells us that the explained variance in the model is extremely high.
In other words, the model is able to do a good job of using the predictor variables to explain the variation in the response variable.
Related: What is a Good R-squared Value?