One question students often have in statistics is:
Is it possible to perform a t-test when the sample sizes of each group are not equal?
The short answer:
Yes, you can perform a t-test when the sample sizes are not equal. Equal sample sizes is not one of the assumptions made in a t-test.
The real issues arise when the two samples do not have equal variances, which is one of the assumptions made in a t-test.
When this occurs, it’s recommended that you use Welch’s t-test instead, which does not make the assumption of equal variances.
The following examples demonstrate how to perform t-tests with unequal sample sizes when the variances are equal and when they’re not equal.
Example 1: Unequal Sample Sizes and Equal Variances
Suppose we administer two programs designed to help students score higher on some exam.
The results are as follows:
Program 1:
- n (sample size): 500
- x (sample mean): 80
- s (sample standard deviation): 5
Program 2:
- n (sample size): 20
- x (sample mean): 85
- s (sample standard deviation): 5
The following code shows how to create a boxplot in R to visualize the distribution of exam scores for each program:
#make this example reproducible
set.seed(1)

#create vectors to hold exam scores
program1 #create boxplots to visualize distribution of exam scores
boxplot(program1, program2, names=c("Program 1","Program 2"))
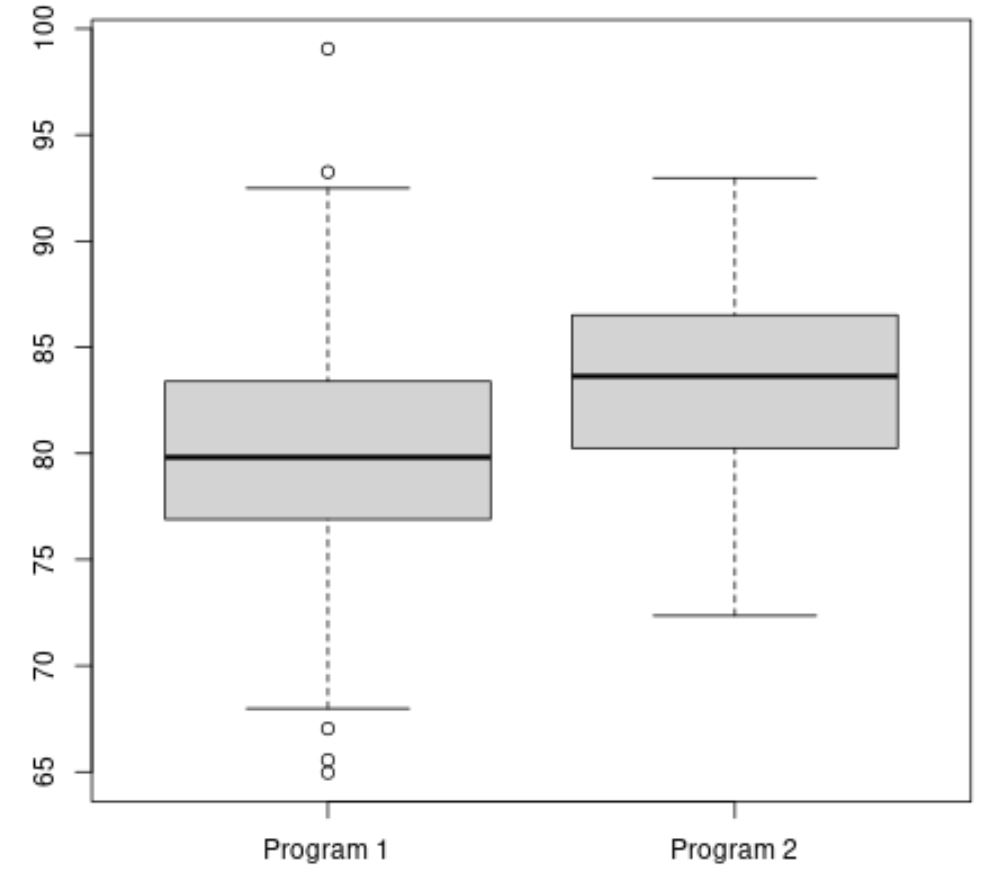
The mean exam score for Program 2 appears to be higher, but the variance of exam scores between the two programs is roughly equal.
The following code shows how to perform an independent samples t-test along with a Welch’s t-test:
#perform independent samples t-test
t.test(program1, program2, var.equal=TRUE)

	Two Sample t-test

data:  program1 and program2
t = -3.3348, df = 518, p-value = 0.0009148
alternative hypothesis: true difference in means is not equal to 0
95 percent confidence interval:
 -6.111504 -1.580245
sample estimates:
mean of x mean of y
 80.11322  83.95910

#perform Welch's two sample t-test
t.test(program1, program2, var.equal=FALSE)

	Welch Two Sample t-test

data:  program1 and program2
t = -3.3735, df = 20.589, p-value = 0.00293
alternative hypothesis: true difference in means is not equal to 0
95 percent confidence interval:
 -6.219551 -1.472199
sample estimates:
mean of x mean of y
 80.11322  83.95910
The independent samples t-test returns a p-value of .0009 and Welch’s t-test returns a p-value of .0029.
Since the p-value of each test is less than .05, we would reject the null hypothesis in each test and conclude that there is a statistically significant difference in mean exam scores between the two programs.
Even though the sample sizes are unequal, the independent samples t-test and Welch’s t-test both return similar results since the two samples had equal variances.
Example 2: Unequal Sample Sizes and Unequal Variances
Suppose we administer two programs designed to help students score higher on some exam.
The results are as follows:
Program 1:
- n (sample size): 500
- x (sample mean): 80
- s (sample standard deviation): 25
Program 2:
- n (sample size): 20
- x (sample mean): 85
- s (sample standard deviation): 5
The following code shows how to create a boxplot in R to visualize the distribution of exam scores for each program:
#make this example reproducible
set.seed(1)

#create vectors to hold exam scores
program1 #create boxplots to visualize distribution of exam scores
boxplot(program1, program2, names=c("Program 1","Program 2"))
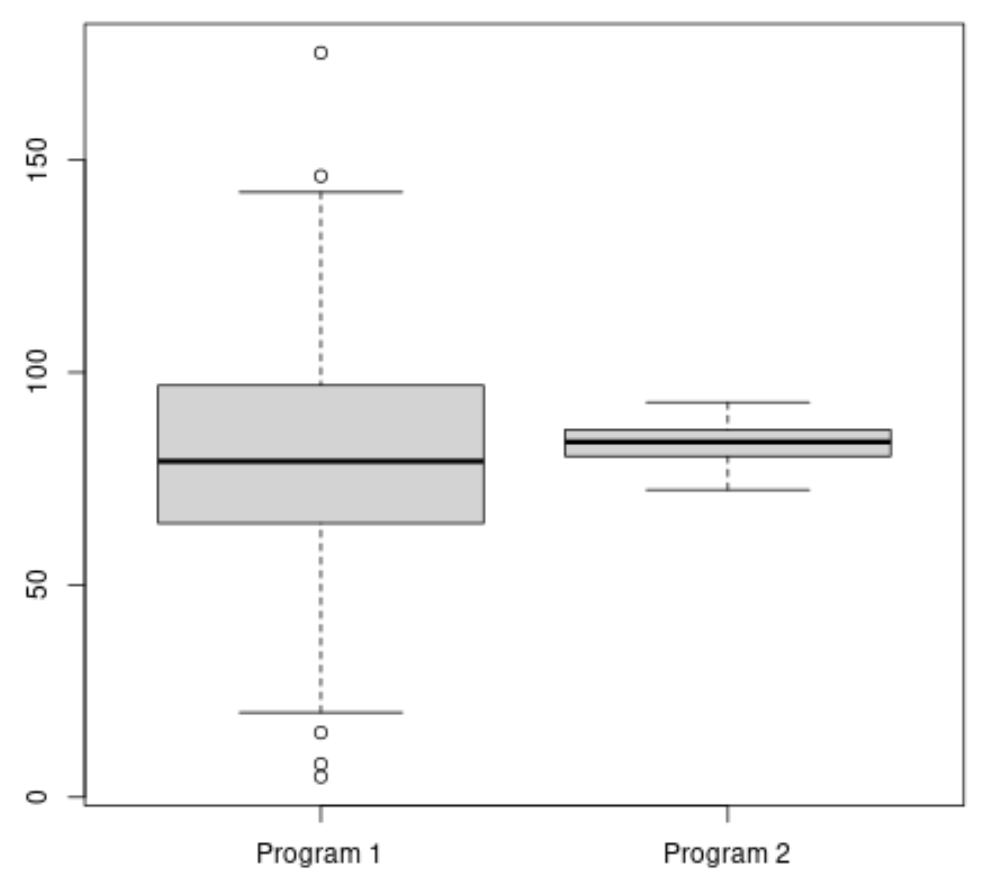
The mean exam score for Program 2 appears to be higher, but the variance of exam scores for Program 1 is much higher than Program 2.
The following code shows how to perform an independent samples t-test along with a Welch’s t-test:
#perform independent samples t-test
t.test(program1, program2, var.equal=TRUE)

	Two Sample t-test

data:  program1 and program2
t = -0.5988, df = 518, p-value = 0.5496
alternative hypothesis: true difference in means is not equal to 0
95 percent confidence interval:
 -14.52474   7.73875
sample estimates:
mean of x mean of y
  80.5661   83.9591

#perform Welch's two sample t-test
t.test(program1, program2, var.equal=FALSE)

	Welch Two Sample t-test

data:  program1 and program2
t = -2.1338, df = 74.934, p-value = 0.03613
alternative hypothesis: true difference in means is not equal to 0
95 percent confidence interval:
 -6.560690 -0.225296
sample estimates:
mean of x mean of y
  80.5661   83.9591
The independent samples t-test returns a p-value of .5496 and Welch’s t-test returns a p-value of .0361.
The independent samples t-test is not able to detect a difference in mean exam scores, but the Welch’s t-test is able to detect a statistically significant difference.
Since the two samples had unequal variances, only Welch’s t-test was able to detect the statistically significant difference in mean exam scores since this test does not make the assumption of equal variances between samples.
Additional Resources
The following tutorials provide additional information about t-tests:
Introduction to the One Sample t-test
Introduction to the Two Sample t-test
Introduction to the Paired Samples t-test