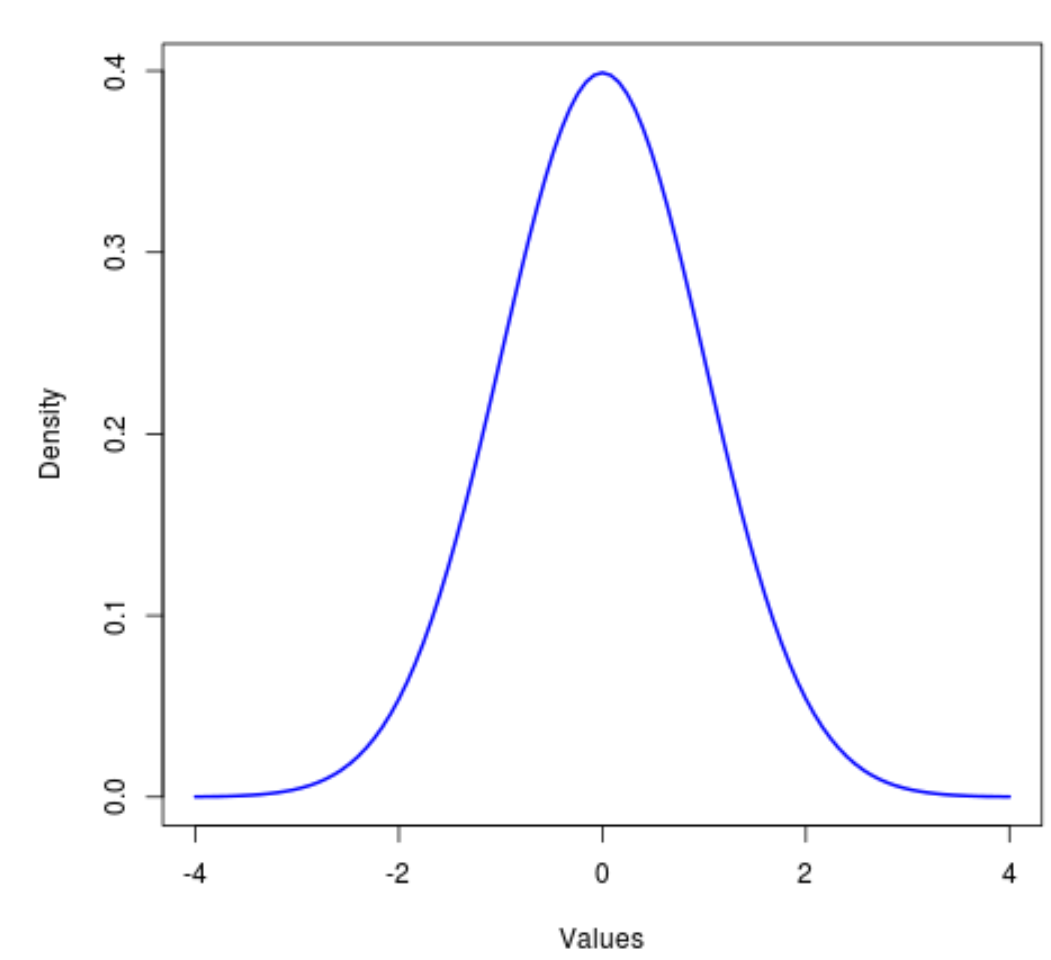
The normal distribution is the most commonly used distribution in all of statistics and is known for being symmetrical and bell-shaped.
A closely related distribution is the t-distribution, which is also symmetrical and bell-shaped but it has heavier “tails” than the normal distribution.
That is, more values in the distribution are located in the tail ends than the center compared to the normal distribution:
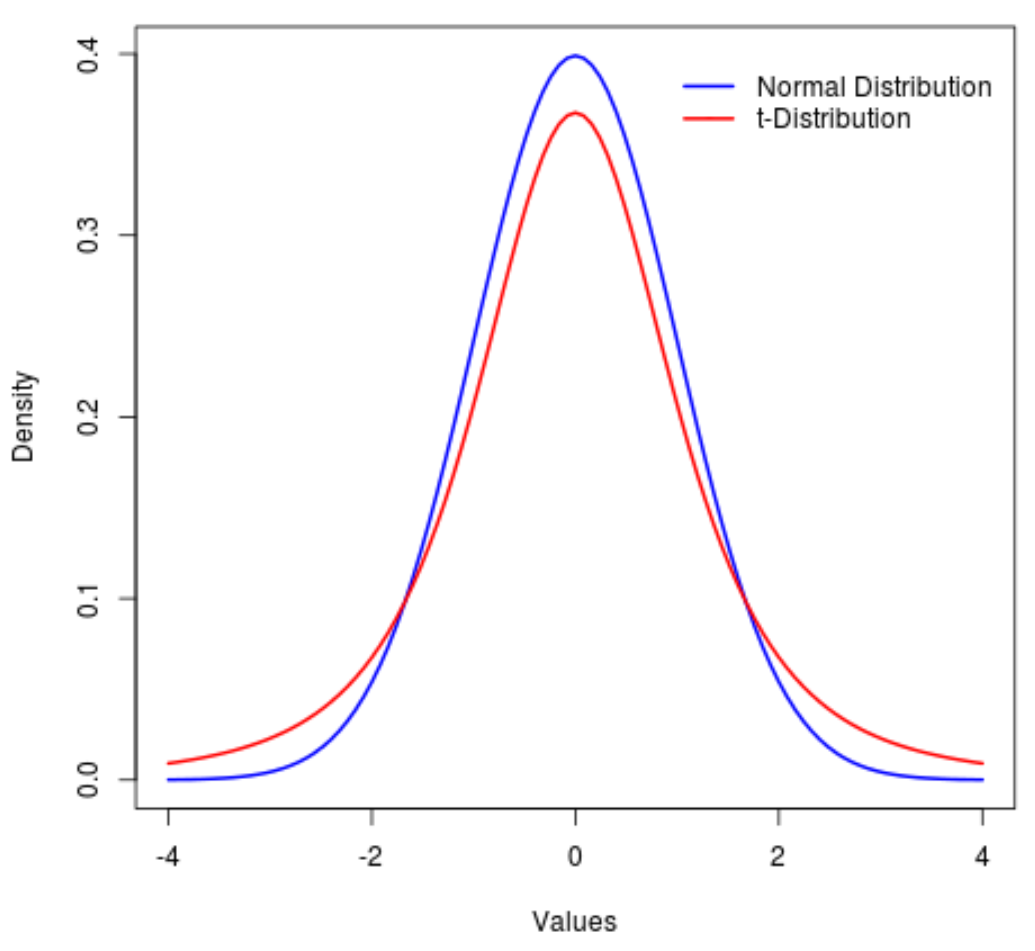
In statistical jargon we use a metric called kurtosis to measure how “heavy-tailed” a distribution is. Thus, we would say that the kurtosis of a t-distribution is greater than a normal distribution.
In practice, we use the t-distribution most often when performing hypothesis tests or constructing confidence intervals.
For example, the formula to calculate a confidence interval for a population mean is as follows:
Confidence Interval = x +/- t1-α/2, n-1*(s/√n)
where:
- x: sample mean
- t: the critical t-value, based on the significance level α and sample size n
- s: sample standard deviation
- n: sample size
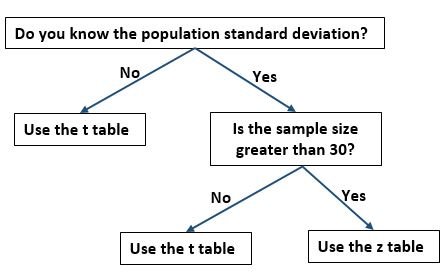
In this formula we use the critical value from the t table instead of the critical value from the z table when either one of the following is true:
- We do not know the population standard deviation.
- The sample size is less than or equal to 30.
The following flow diagram provides a helpful way to know whether you should use the critical value from the t table or the z table:
The main difference between using the t-distribution compared to the normal distribution when constructing confidence intervals is that critical values from the t-distribution will be larger, which leads to wider confidence intervals.
For example, suppose we’d like to construct a 95% confidence interval for the mean weight for some population of turtles so we go out and collect a random sample of turtles with the following information:
- Sample size n = 25
- Sample mean weight x = 300
- Sample standard deviation s = 18.5
The z-critical value for a 95% confidence level is 1.96 while a t-critical value for a 95% confidence interval with df = 25-1 = 24 degrees of freedom is 2.0639.
Thus, a 95% confidence interval for the population mean using a z-critical value is:
95% C.I. = 300 +/- 1.96*(18.5/√25) = [ 292.75 , 307.25]
While a 95% confidence interval for the population mean using a t-critical value is:
95% C.I. = 300 +/- 2.0639*(18.5/√25) = [ 292.36 , 307.64]
Notice that the confidence interval with the t-critical value is wider.
The idea here is that when we have small sample sizes, we’re less certain about the true population mean so it makes since to use the t-distribution to produce wider confidence intervals that have a higher chance of containing the true population mean.
Visualizing Degrees of Freedom for the t-Distribution
It’s worth noting that as the degrees of freedom increases, the t-distribution approaches the normal distribution.
To illustrate this, consider the following graph that shows the shape of the t-distribution with the following degrees of freedom:
- df = 3
- df = 10
- df = 30
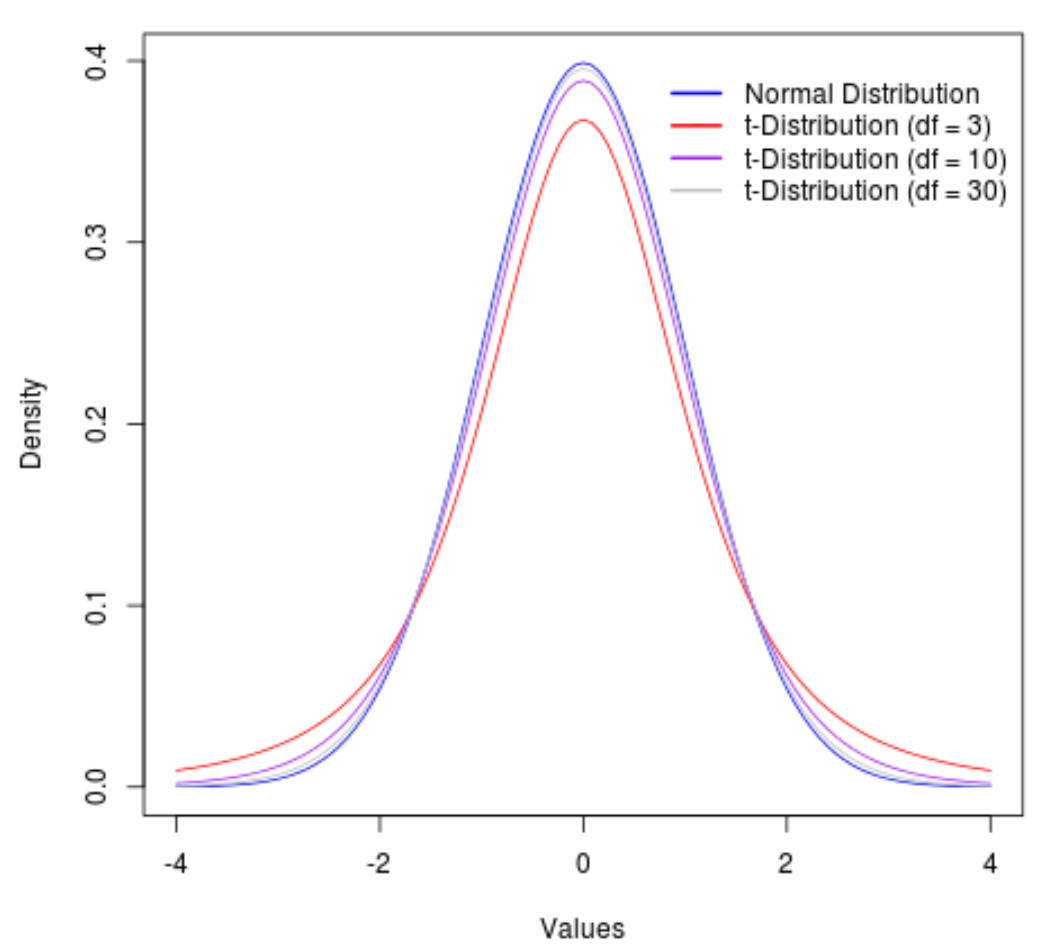
Beyond 30 degrees of freedom, the t-distribution and the normal distribution become so similar that the differences between using a t-critical value vs. a z-critical value in formulas becomes negligible.