An Anderson-Darling Test is a goodness of fit test that measures how well your data fit a specified distribution. This test is most commonly used to determine whether or not your data follow a normal distribution.
This type of test is useful for testing for normality, which is a common assumption used in many statistical tests including regression, ANOVA, t-tests, and many others.
Example: Anderson-Darling Test in R
To conduct an Anderson-Darling Test in R, we can use the ad.test() function within the nortest library.
The following code illustrates how to conduct an A-D test to test whether or not a vector of 100 values follows a normal distribution:
#install (if not already installed) and load nortest library
install.packages('nortest')
library(nortest)

#make this example reproducible
set.seed(1)

#defined vector of 100 values that are normally distributed
x

#conduct Anderson-Darling Test to test for normality
ad.test(x)

#	Anderson-Darling normality test
#
#data:  x
#A = 0.16021, p-value = 0.9471
This test returns two values:
A: the test statistic.
p-value: the corresponding p-value of the test statistic.
The null hypothesis for the A-D test is that the data does follow a normal distribution. Thus, if our p-value for the test is below our significance level (common choices are 0.10, 0.05, and 0.01), then we can reject the null hypothesis and conclude that we have sufficient evidence to say our data does not follow a normal distribution.
In this case, our p-value is 0.9471. Since this is not below our significance level (let’s say .05), we do not have sufficient evidence to reject the null hypothesis. It’s safe to say that our data follows a normal distribution, which makes sense considering we generated 100 values that follow a normal distribution with a mean of 0 and standard deviation of 1 using the rnorm() function in R.
Related: A Guide to dnorm, pnorm, qnorm, and rnorm in R
Suppose instead we generate a vector of 100 values that follow a uniform distribution between 0 and 1. We can conduct an A-D test once again to see if this data follows a normal distribution:
#make this example reproducible
set.seed(1)

#defined vector of 100 values that are uniformly distributed
x #conduct Anderson-Darling Test to test for normality
ad.test(x)

#	Anderson-Darling normality test
#
#data:  x
#A = 1.1472, p-value = 0.005086
Our test statistic A equals 1.1472 and the corresponding p-value equals 0.005086. Since our p-value is less than 0.05, we can reject the null hypothesis and conclude that we have sufficient evidence to say this data does not follow a normal distribution. This matches the result we expected since we know that our data actually follows a uniform distribution.
Conducting an Anderson-Darling Test on One Column of a Data Frame in R
We can also conduct an AD-test for a specified column of a data frame in R. For example, consider the built-in iris dataset:
#view first six lines of iris dataset
head(iris)

#  Sepal.Length Sepal.Width Petal.Length Petal.Width Species
#1          5.1         3.5          1.4         0.2  setosa
#2          4.9         3.0          1.4         0.2  setosa
#3          4.7         3.2          1.3         0.2  setosa
#4          4.6         3.1          1.5         0.2  setosa
#5          5.0         3.6          1.4         0.2  setosa
#6          5.4         3.9          1.7         0.4  setosa
Suppose we want to know whether or not the variable Petal.Width is normally distributed. We could first create a histogram to visualize the distribution of values:
hist(iris$Petal.Width, col = 'steelblue', main = 'Distribution of Petal Widths',
     xlab = 'Petal Width')
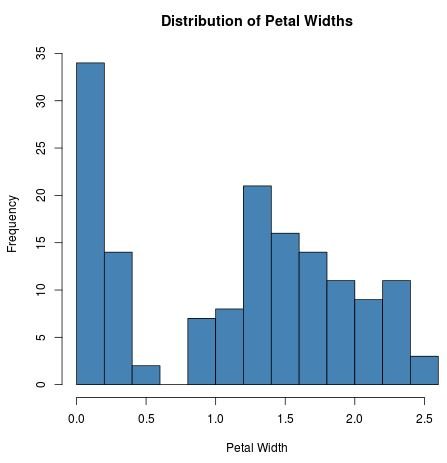
The data does not appear to be normally distributed. To confirm this, we can conduct an A-D test to formally test whether or not the data is normally distributed:
#conduct Anderson-Darling Test to test for normality
ad.test(iris$Petal.Width)

#	Anderson-Darling normality test
#
#data:  iris$Petal.Width
#A = 5.1057, p-value = 1.125e-12
The p-value of the test is less than 0.05, thus we have sufficient evidence to reject the null hypothesis and conclude that Petal.Width does not follow a normal distribution.