You can use the width argument to change the width of bars in a seaborn bar plot:
sns.barplot(x='xvar', y='yvar', data=df, width=0.8)
The default value for width is 0.8.
The smaller the value for width, the thinner the bars will be.
The following example shows how to use this argument in practice.
Example: Change Width of Bars in Seaborn Bar Plot
Suppose we have the following pandas DataFrame that contains information about the total sales made by various employees at a company:
import pandas as pd

#create DataFrame
df = pd.DataFrame({'employee': ['Andy', 'Bert', 'Chad', 'Doug', 'Eric', 'Frank'],
                   'sales': [22, 14, 9, 7, 29, 20]})

#view DataFrame
print(df)

  employee  sales
0     Andy     22
1     Bert     14
2     Chad      9
3     Doug      7
4     Eric     29
5    Frank     20
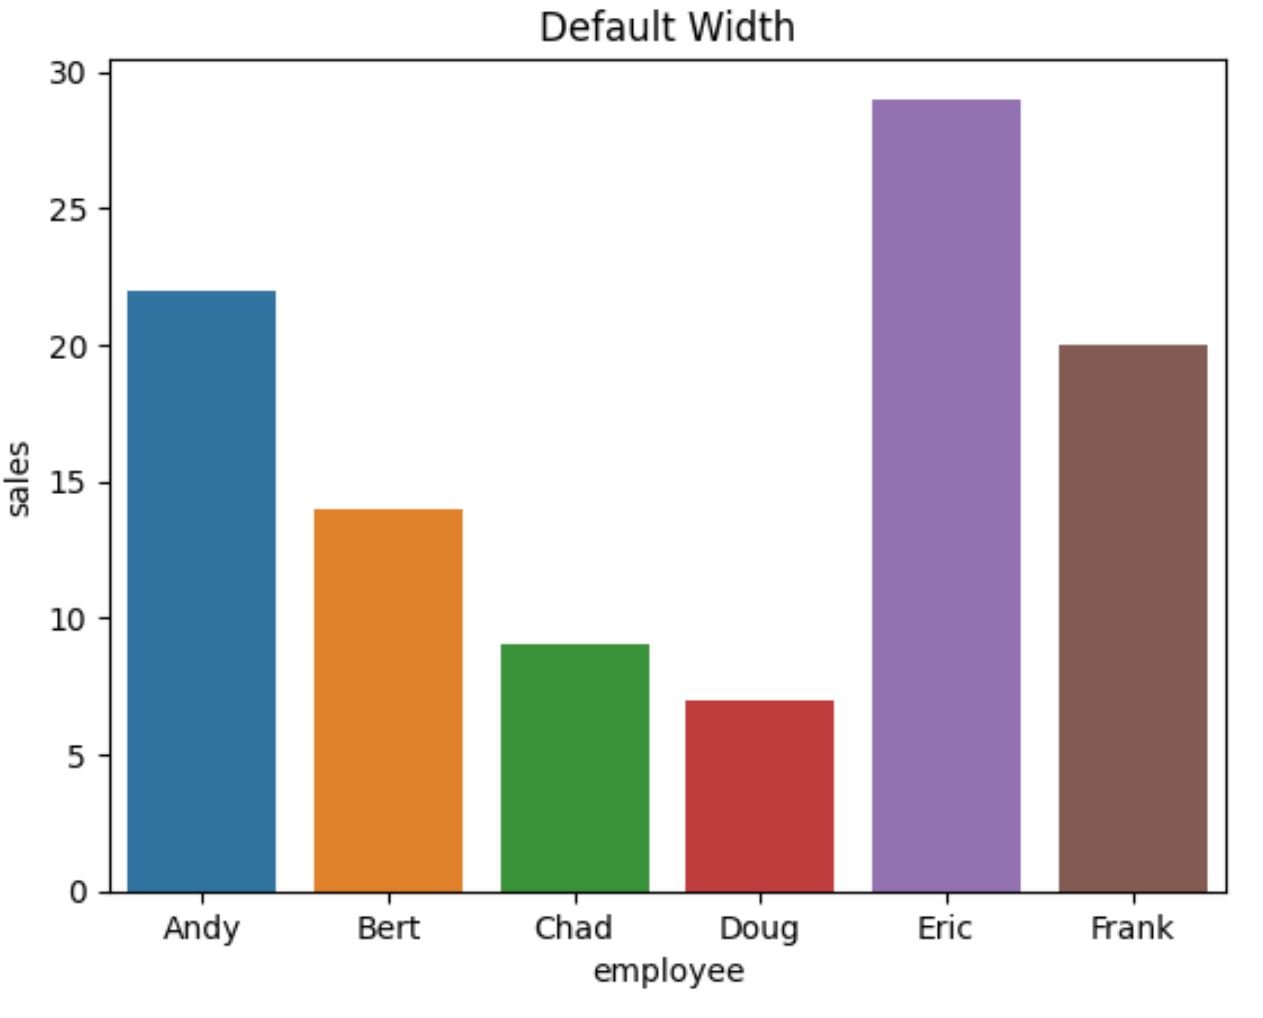
We can use the following syntax to create a bar plot in seaborn using the default value of 0.8 for width:
import seaborn as sns

#create bar plot with default width
sns.barplot(x='employee', y='sales', data=df).set(title='Default Width')
The following code shows how to decrease the width of each bar by setting the width argument equal to 0.4:
import seaborn as sns

#create bar plot with width = 0.4
sns.barplot(x='employee', y='sales', data=df, width=0.4).set(title='Width = 0.4')

Notice that the bars are much thinner in this plot compared to the previous one.
If you’d like each of the bars to be touching, you can set the width equal to 1:
import seaborn as sns

#create bar plot with width = 1
sns.barplot(x='employee', y='sales', data=df, width=1).set(title='Width = 1')
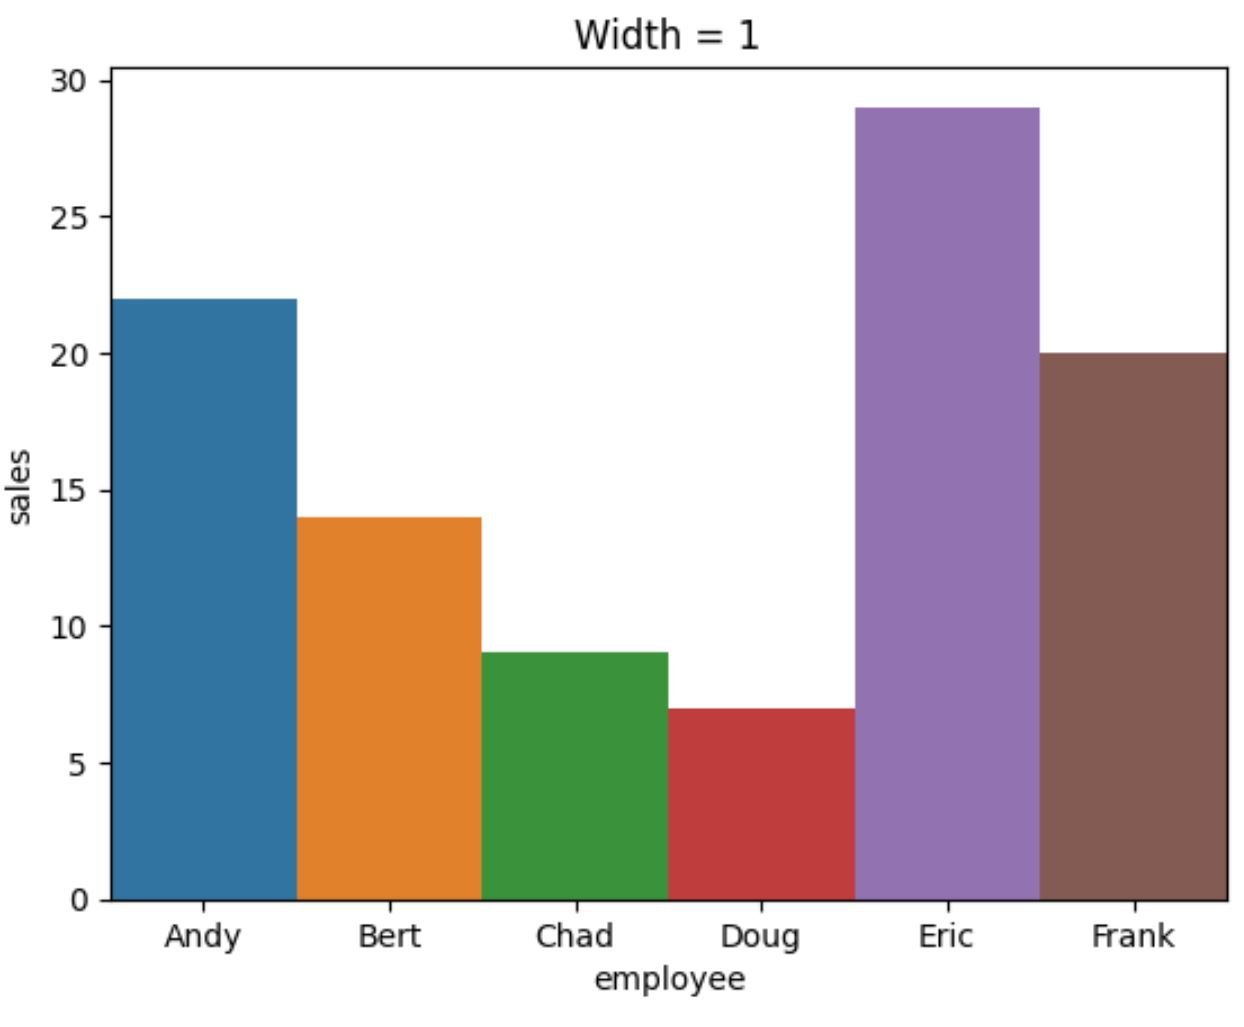
Note that if you set the width equal to any value greater than 1, the bars will be overlapping.
Note: You can find the complete documentation for the barplot() function in seaborn here.
Additional Resources
The following tutorials explain how to perform other common functions in seaborn:
How to Show Values on Seaborn Barplot
How to Create a Grouped Barplot in Seaborn
How to Set the Color of Bars in a Seaborn Barplot