You can use the LINEST() function in Excel to fit a polynomial curve with a certain degree.
For example, you can use the following basic syntax to fit a polynomial curve with a degree of 3:
=LINEST(known_ys, known_xs^{1, 2, 3})
The function returns an array of coefficients that describes the polynomial fit.
The following step-by-step example shows how to use this function to fit a polynomial curve in Excel.
Step 1: Create the Data
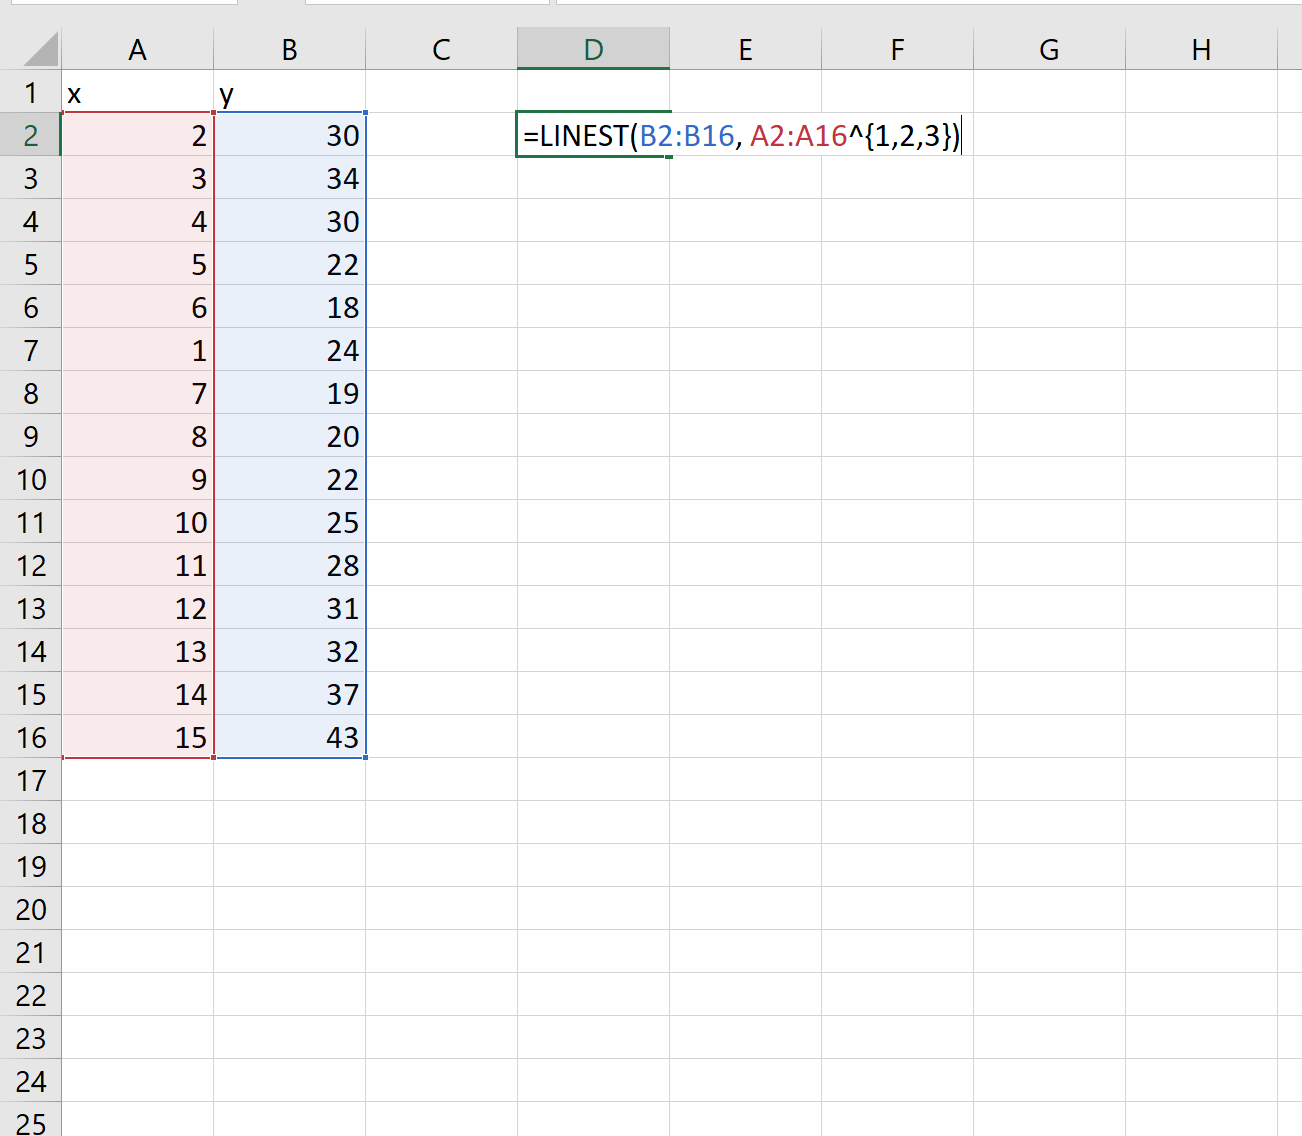
First, let’s create some data to work with:

Step 2: Fit a Polynomial Curve
Next, let’s use the LINEST() function to fit a polynomial curve with a degree of 3 to the dataset:
Step 3: Interpret the Polynomial Curve
Once we press ENTER, an array of coefficients will appear:
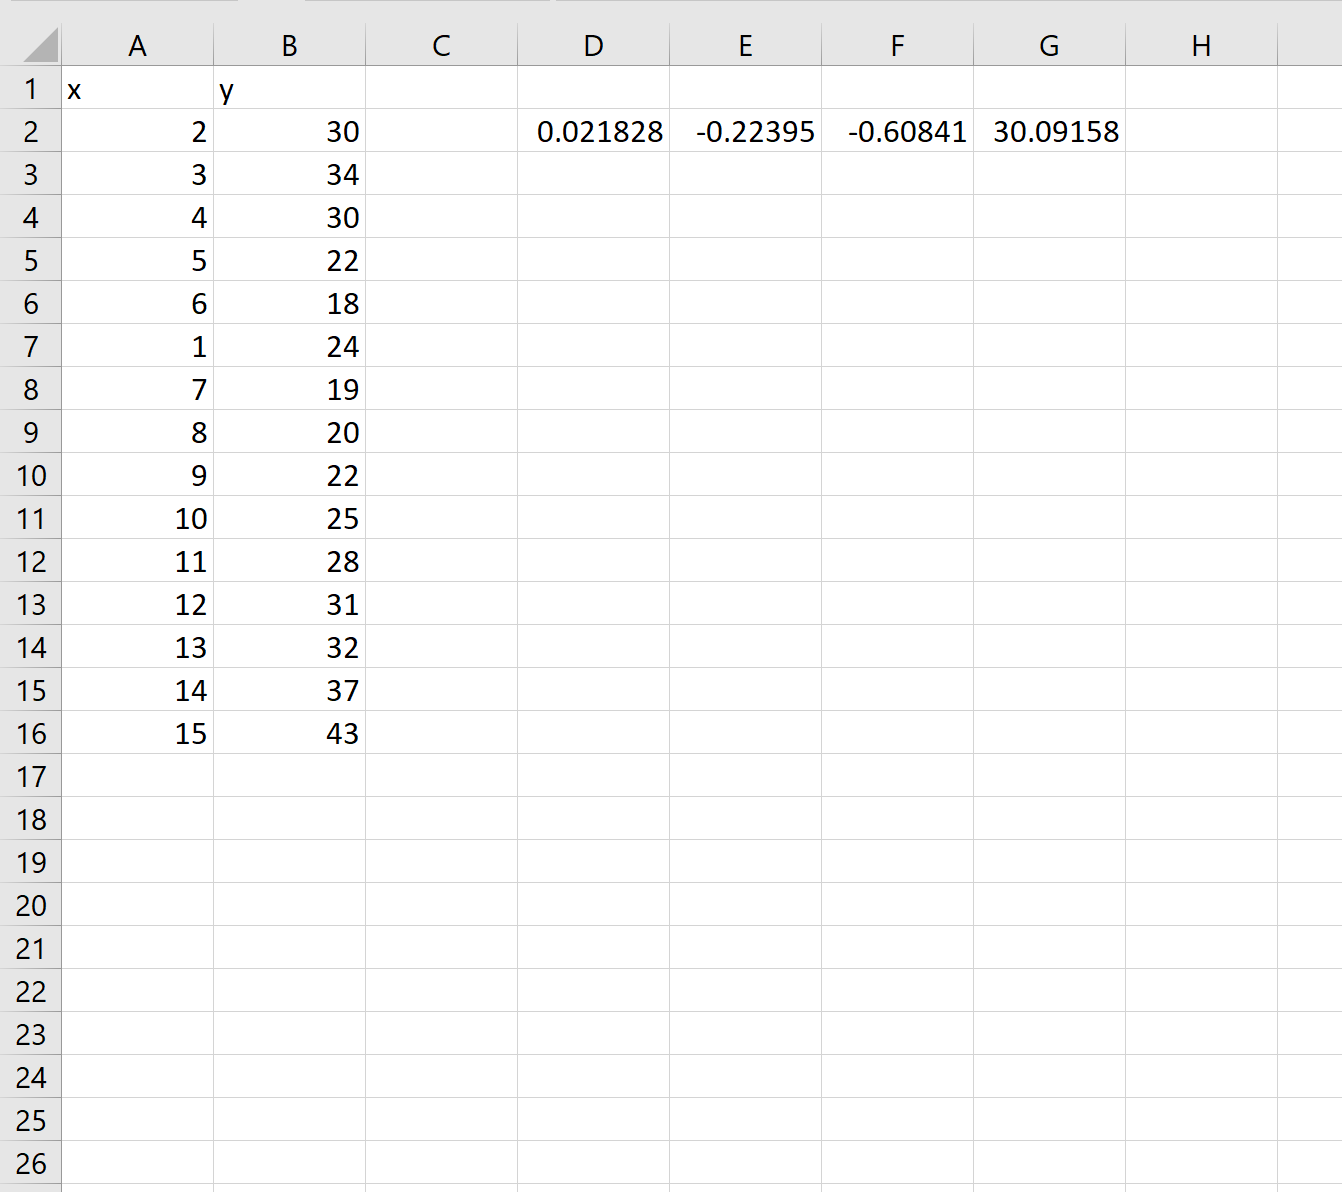
Using these coefficients, we can construct the following equation to describe the relationship between x and y:
y = .0218x3 – .2239x2 – .6084x + 30.0915
We can also use this equation to calculate the expected value of y, based on the value of x.
For example, suppose x = 4. The expected value of y would be:
y = .0218(4)3 – .2239(4)2 – .6084(4) + 30.0915 = 25.47
Additional Resources
How to Perform Polynomial Regression in Excel
How to Perform Quadratic Regression in Excel
How to Add a Quadratic Trendline in Excel