A residual is the difference between an observed value and a predicted value in a regression model.
It is calculated as:
Residual = Observed value – Predicted value
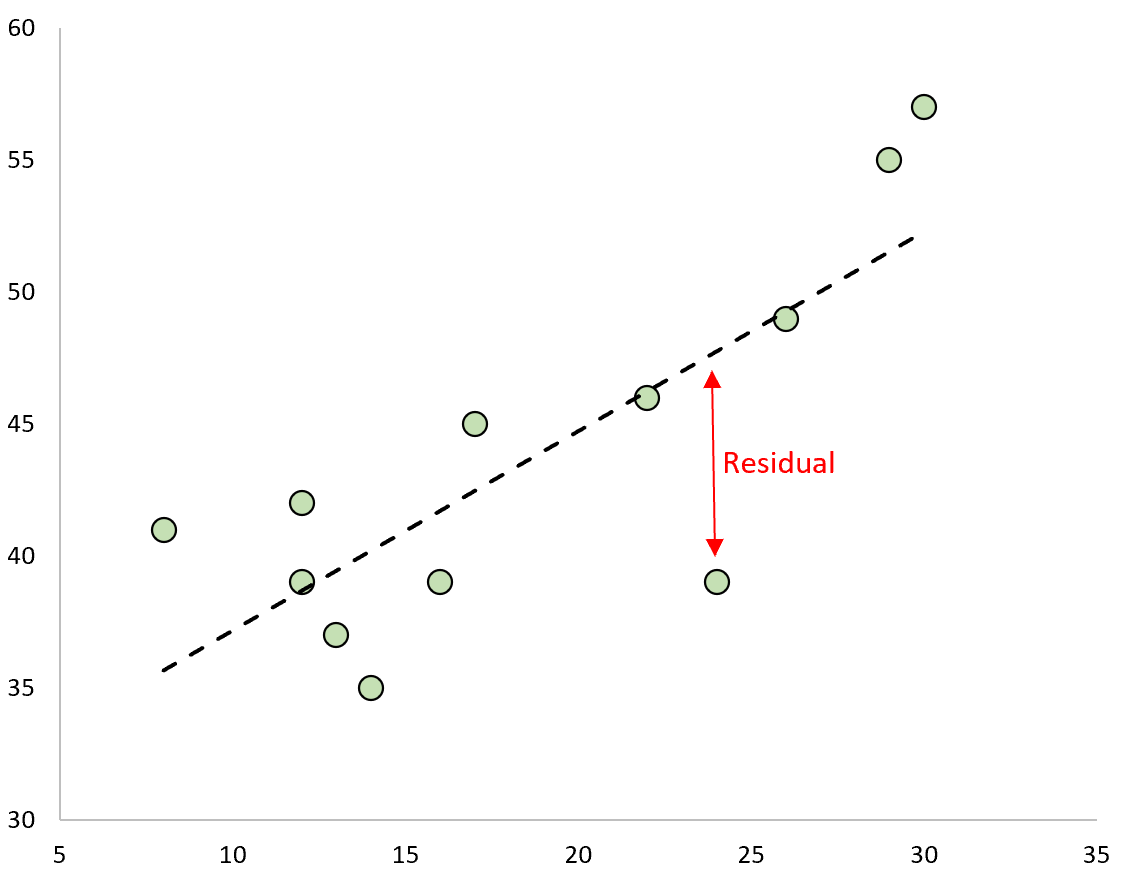
If we plot the observed values and overlay the fitted regression line, the residuals for each observation would be the vertical distance between the observation and the regression line:
One type of residual we often use to identify outliers in a regression model is known as a standardized residual.
It is calculated as:
ri = ei / s(ei) = ei / RSE√1-hii
where:
- ei: The ith residual
- RSE: The residual standard error of the model
- hii: The leverage of the ith observation
In practice, we often consider any standardized residual with an absolute value greater than 3 to be an outlier.
This doesn’t necessarily mean that we’ll remove these observations from the model, but we should at least investigate them further to verify that they’re not a result of a data entry error or some other odd occurrence.
Note: Sometimes standardized residuals are also referred to as “internally studentized residuals.”
Example: How to Calculate Standardized Residuals
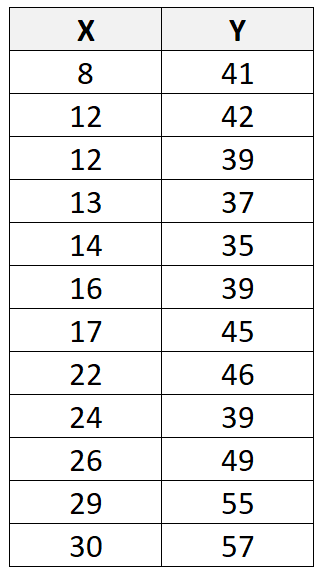
Suppose we have the following dataset with 12 total observations:
If we use some statistical software (like R, Excel, Python, Stata, etc.) to fit a linear regression line to this dataset, we’ll find that the line of best fit turns out to be:
y = 29.63 + 0.7553x
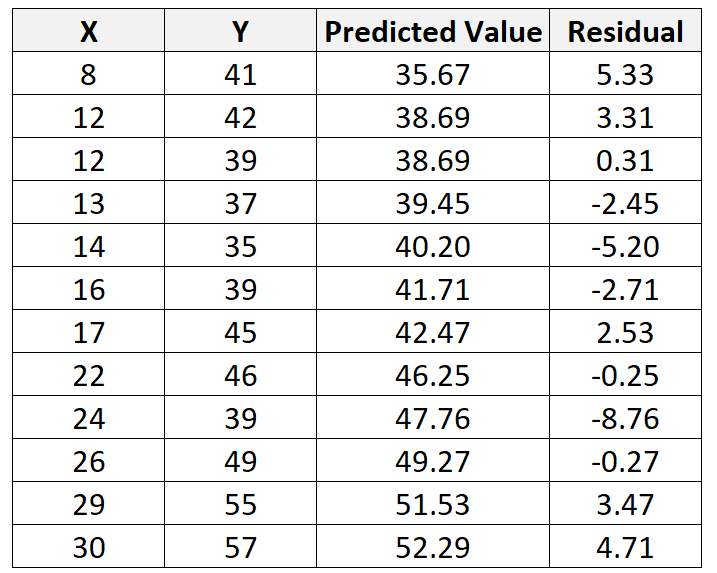
Using this line, we can calculate the predicted value for each Y value based on the value of X. For example, the predicted value of the first observation would be:
y = 29.63 + 0.7553*(8) = 35.67
We can then calculate the residual for this observation as:
Residual = Observed value – Predicted value = 41 – 35.67 = 5.33
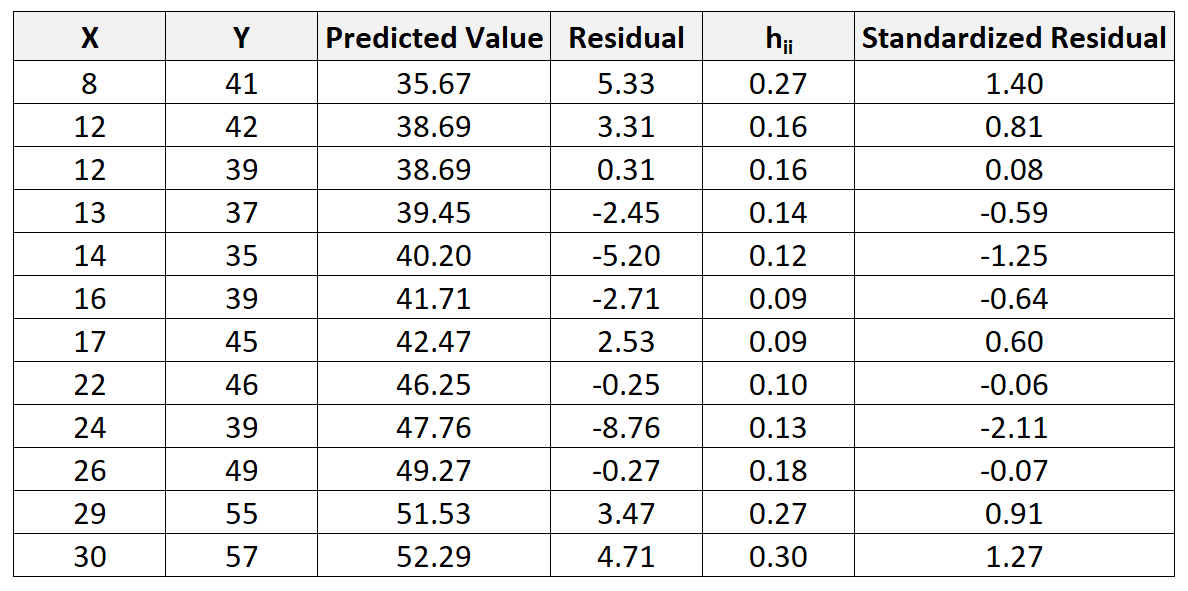
We can repeat this process to find the residual for every single observation:
We can also use statistical software to find that the residual standard error of the model is 4.44.
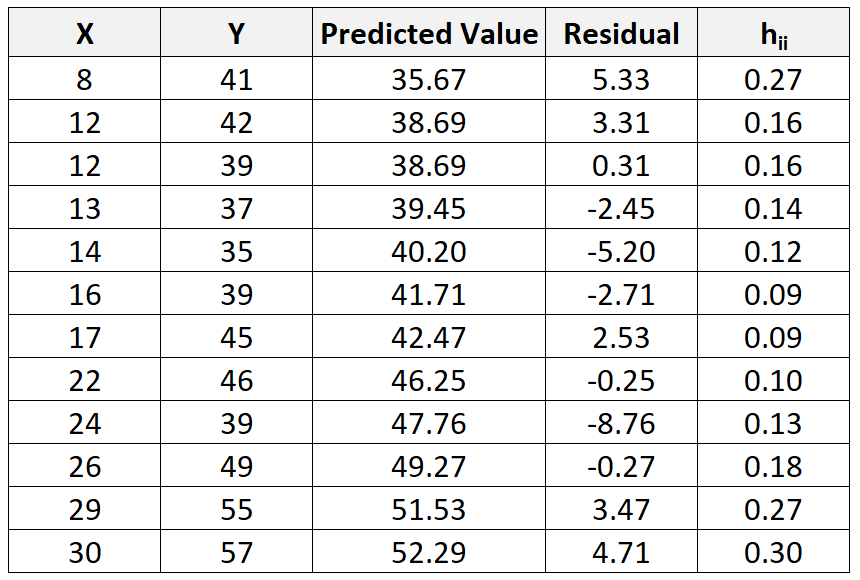
And, although it’s beyond the scope of this tutorial, we can use software to find the leverage statistic (hii) for each observation:
We can then use the following formula to calculate the standardized residual for each observation:
ri = ei / RSE√1-hii
For example, the standardized residual for the first observation is calculated as:
ri = 5.33 / 4.44√1-.27 = 1.404
We can repeat this process to find the standardized residual for each observation:
We can then create a quick scatterplot of the predictor values vs. standardized residuals to visually see if any of the standardized residuals exceed an absolute value threshold of 3:
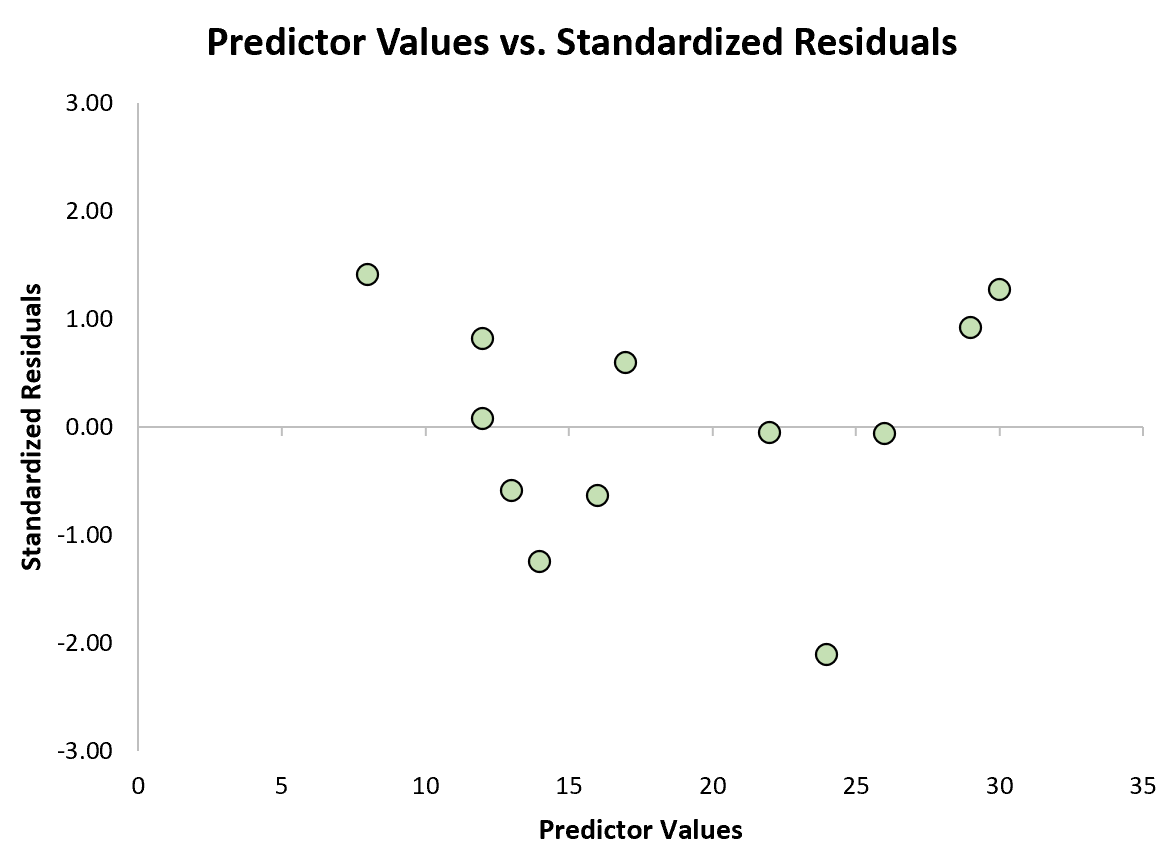
From the plot we can see that none of the standardized residuals exceed an absolute value of 3. Thus, none of the observations appear to be outliers.
It’s worth noting in some cases that researchers consider observations with standardized residuals that exceed an absolute value of 2 to be considered outliers.
It’s up to you to decide, depending on the field you’re working in and the specific problem you’re working on, whether to use an absolute value of 2 or 3 as the threshold for outliers.
Additional Resources
What Are Residuals in Statistics?
How to Calculate Standardized Residuals in Excel
How to Calculate Standardized Residuals in R
How to Calculate Standardized Residuals in Python