You can use the following basic syntax to change the background color of a Seaborn plot in Python:
sns.set(rc={'axes.facecolor':'lightblue', 'figure.facecolor':'lightgreen'})
The following example shows how to use this syntax in practice.
Example: Change Background Color in Seaborn
The following code shows how to create a scatterplot in Seaborn with a light blue background inside the plot and a light green background outside the plot:
import seaborn as sns
import matplotlib.pyplot as plt

#define data
x = [1, 2, 2, 3, 5, 6, 6, 7, 9, 10, 12, 13]
y = [8, 8, 10, 12, 13, 15, 18, 15, 19, 22, 24, 29]

#define seaborn background colors
sns.set(rc={'axes.facecolor':'lightblue', 'figure.facecolor':'lightgreen'})

#create seaborn scatterplot
sns.scatterplot(x, y)
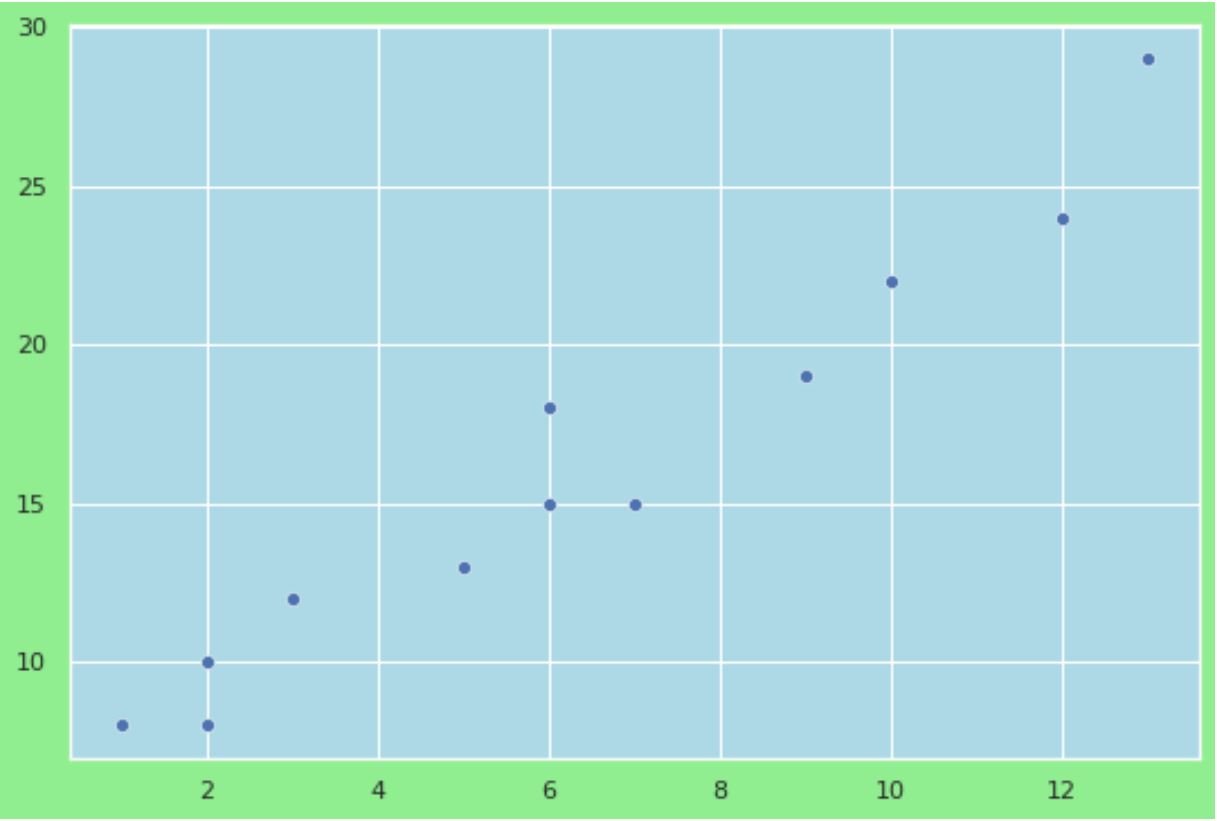
The background color inside the plot is light blue and the background color outside of the plot is light green, just as we specified.
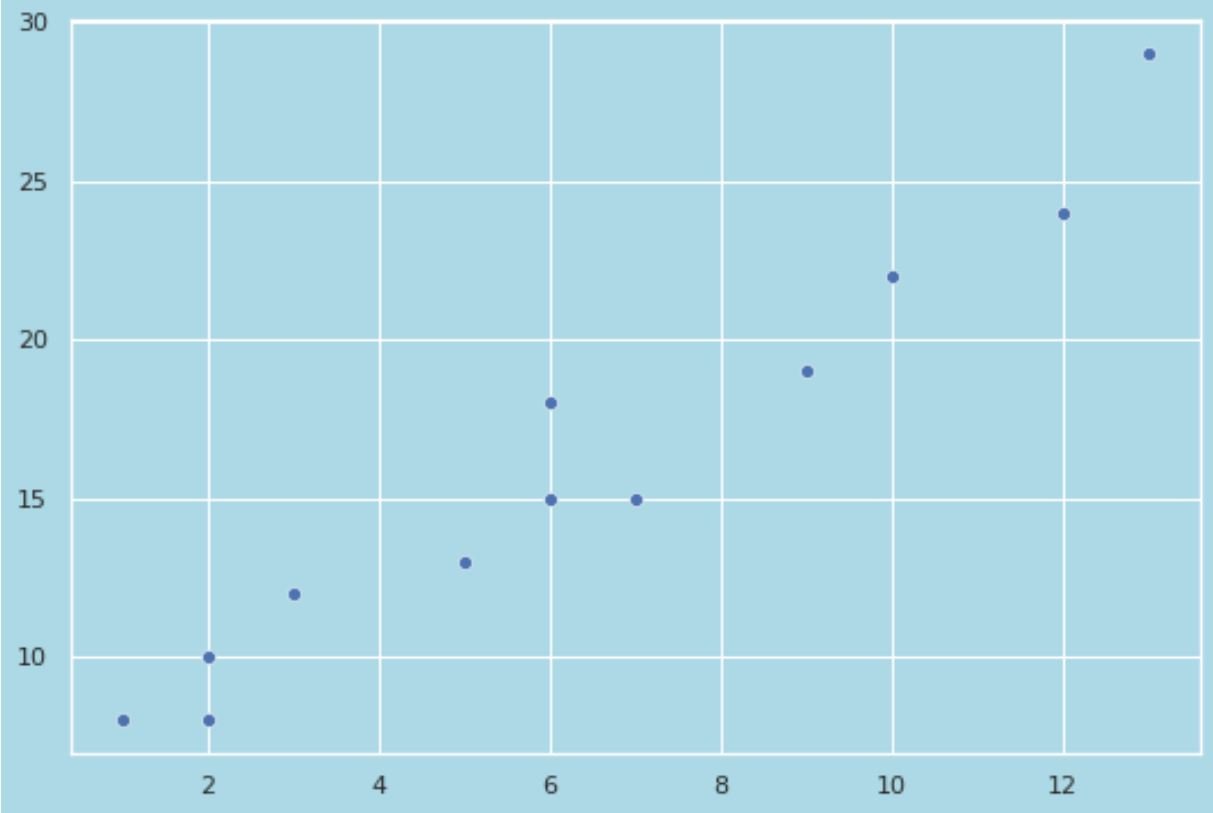
In most cases, it’s more common to use the same color inside and outside of the plot.
For example, we can use the following code to make the background color light blue both inside and outside of the plot:
import seaborn as sns
import matplotlib.pyplot as plt

#define data
x = [1, 2, 2, 3, 5, 6, 6, 7, 9, 10, 12, 13]
y = [8, 8, 10, 12, 13, 15, 18, 15, 19, 22, 24, 29]

#define seaborn background colors
sns.set(rc={'axes.facecolor':'lightblue', 'figure.facecolor':'lightblue'})

#create seaborn scatterplot
sns.scatterplot(x, y)
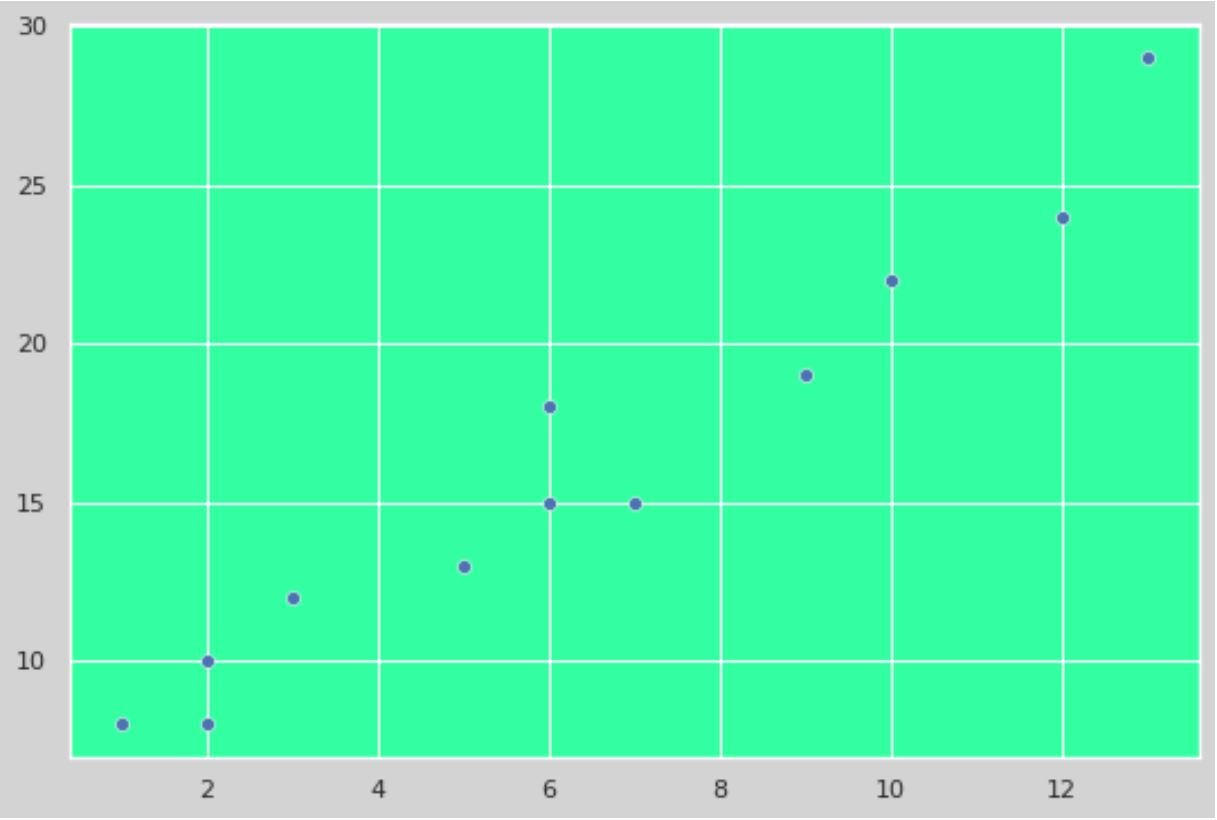
Note that we can also use hex color codes to set specific colors.
For example, we can use the following code to specify #33FFA2 as the background color inside the plot:
import seaborn as sns
import matplotlib.pyplot as plt

#define data
x = [1, 2, 2, 3, 5, 6, 6, 7, 9, 10, 12, 13]
y = [8, 8, 10, 12, 13, 15, 18, 15, 19, 22, 24, 29]

#define seaborn background colors
sns.set(rc={'axes.facecolor':'#33FFA2', 'figure.facecolor':'lightgrey'})

#create seaborn scatterplot
sns.scatterplot(x, y)
Additional Resources
The following tutorials explain how to perform other common operations in Seaborn:
How to Adjust the Figure Size of a Seaborn Plot
How to Change Axis Labels on a Seaborn Plot
How to Adjust Number of Ticks in Seaborn Plots