Often you may want to reorder boxplots in R.
The following examples show how to do so using two different methods:
- Method 1: Reorder Based on Specific Order
- Method 2: Reorder Based on Median Value of Boxplot
Each example will use the built-in airquality dataset in R:
#view first six lines of airquality data
head(airquality)

  Ozone Solar.R Wind Temp Month Day
1    41     190  7.4   67     5   1
2    36     118  8.0   72     5   2
3    12     149 12.6   74     5   3
4    18     313 11.5   62     5   4
5    NA      NA 14.3   56     5   5
6    28      NA 14.9   66     5   6
Here’s what a plot of multiple boxplots will look like for this dataset without specifying an order:
#create boxplot that shows distribution of temperature by month
boxplot(Temp~Month, data=airquality, col="lightblue", border="black")

Example 1: Reorder Boxplots Based on Specific Order
The following code shows how to order the boxplots based on the following order for the Month variable: 5, 8, 6, 9, 7.
#reorder Month values
airquality$Month levels=c(5, 8, 6, 9, 7))

#create boxplot of temperatures by month using the order we specified
boxplot(Temp~Month, data=airquality, col="lightblue", border="black")
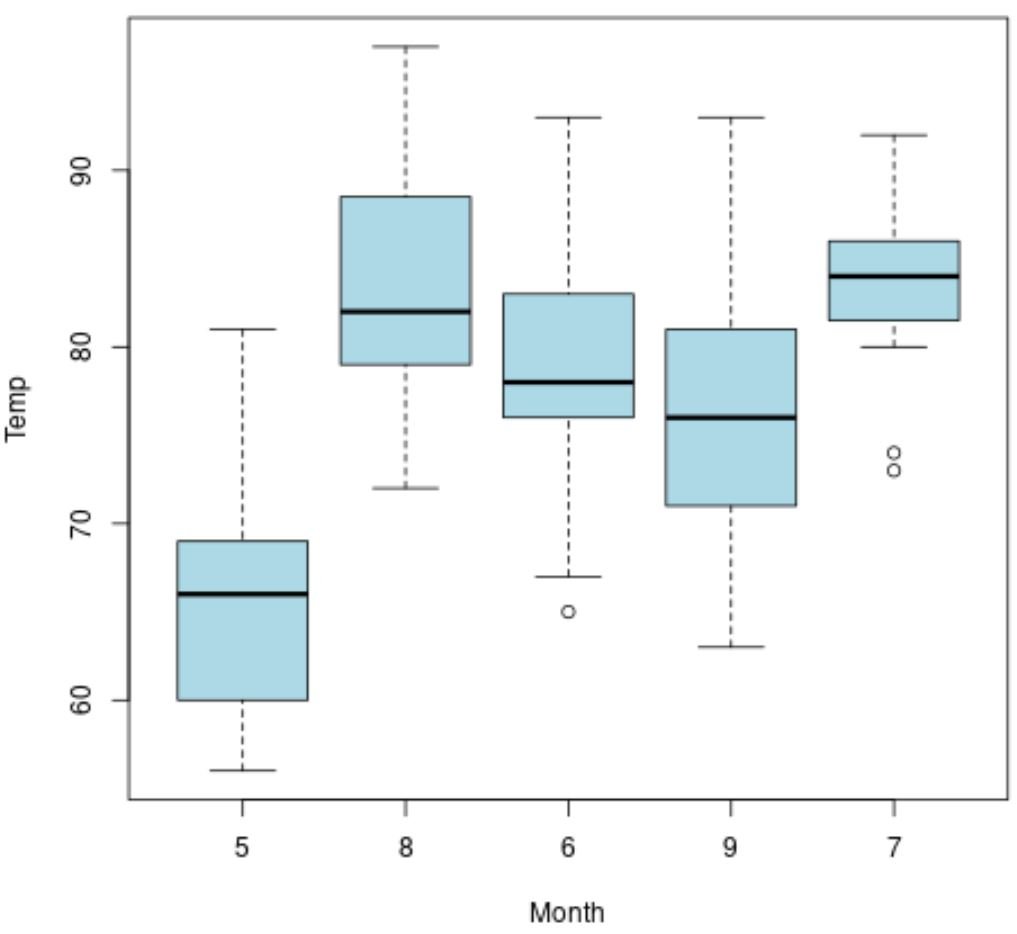
Notice that the boxplots now appear in the order that we specified using the levels argument.
Related: How to Reorder Factor Levels in R
Example 2: Reorder Boxplots Based on Median Value
The following code shows how to order the boxplots in ascending order based on the median temperature value for each month:
#reorder Month values in ascending order based on median value of Temp
airquality$Month rm=T))

#create boxplot of temperatures by month
boxplot(Temp~Month, data=airquality, col="lightblue", border="black")
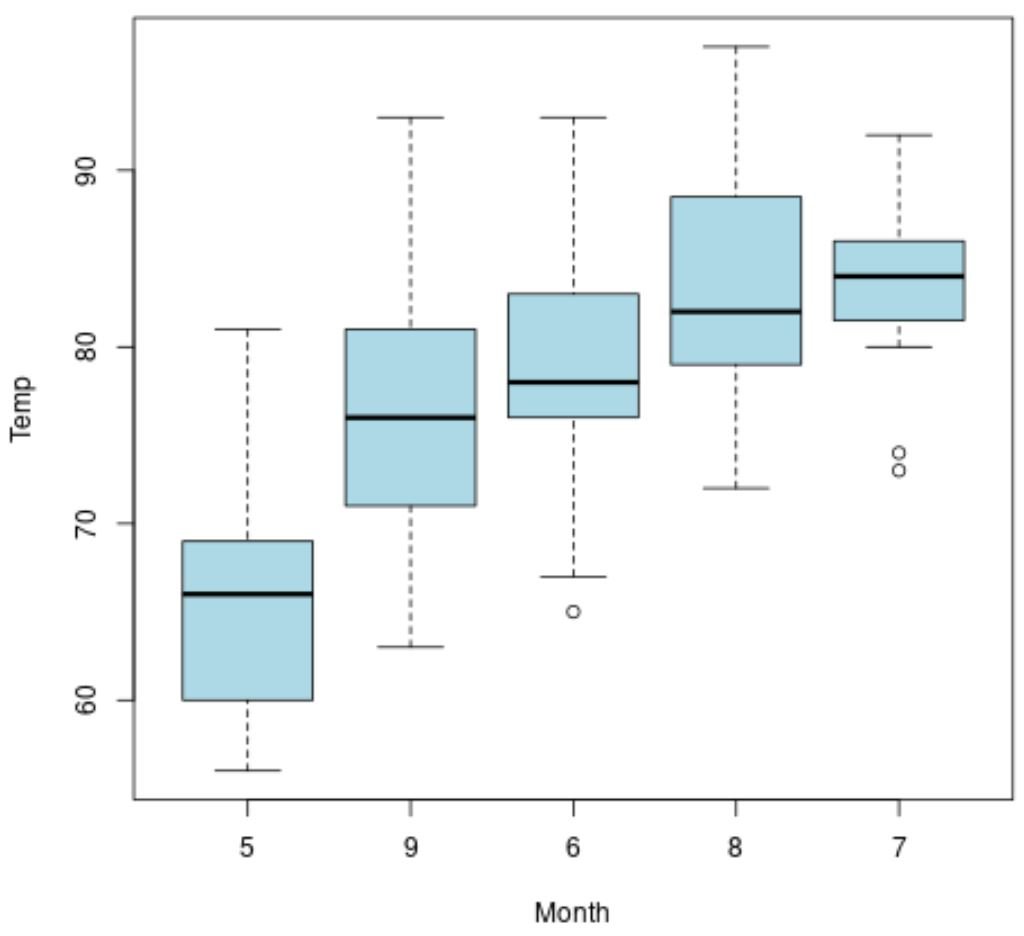
The boxplots now appear in ascending order based on the median value for each month.
Note: The median value for each boxplot is the horizontal black line that runs through the middle of each box.
We can also order the boxplots in descending order by using a negative sign in front of Temp in the reorder function:
#reorder Month values in descending order based on median value of Temp
airquality$Month rm=T))

#create boxplot of temperatures by month
boxplot(Temp~Month, data=airquality, col="lightblue", border="black")

The boxplots now appear in descending order based on the median value for each month.
Additional Resources
The following tutorials explain how to perform other common operations in R:
How to Plot Multiple Boxplots in R
How to Create Horizontal Boxplots in R
How to Remove Outliers in Boxplots in R