Occasionally you may want to remove outliers from boxplots in R.
This tutorial explains how to do so using both base R and ggplot2.
Remove Outliers in Boxplots in Base R
Suppose we have the following dataset:
data
The following code shows how to create a boxplot for this dataset in base R:
boxplot(data)

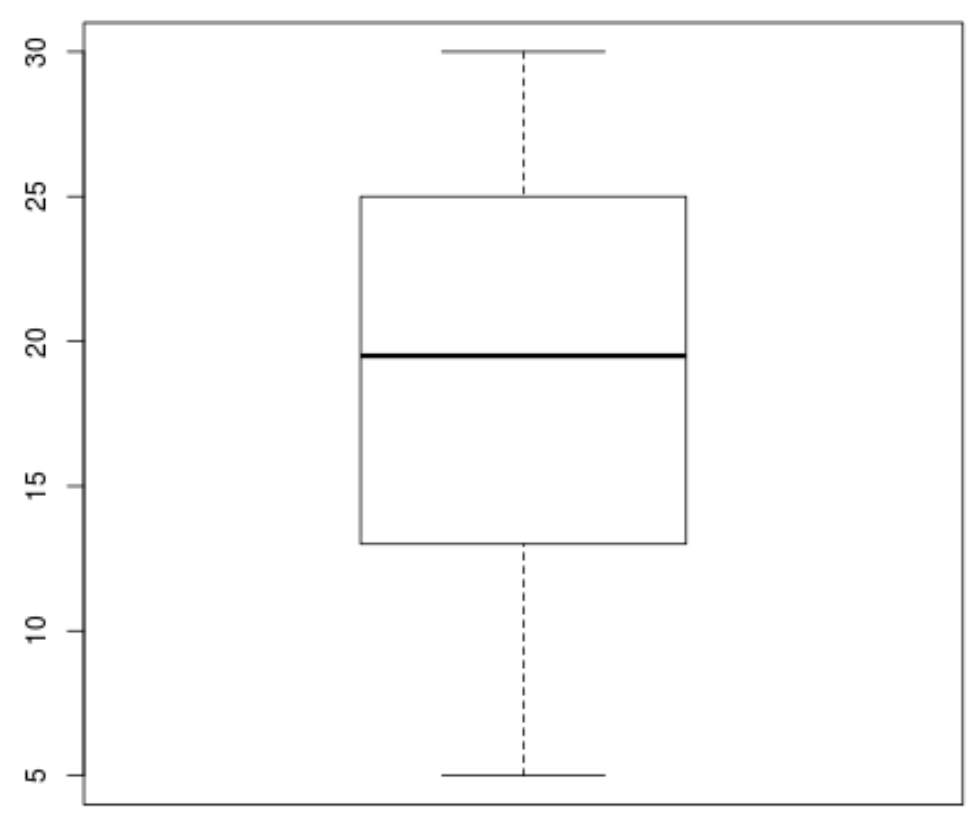
To remove the outliers, you can use the argument outline=FALSE:
boxplot(data, outline=FALSE)
Remove Outliers in Boxplots in ggplot2
Suppose we have the following dataset:
data
The following code shows how to create a boxplot using the ggplot2 visualization library:
library(ggplot2)

ggplot(data, aes(y=y)) +
  geom_boxplot()

To remove the outliers, you can use the argument outlier.shape=NA:
ggplot(data, aes(y=y)) +
  geom_boxplot(outlier.shape = NA)
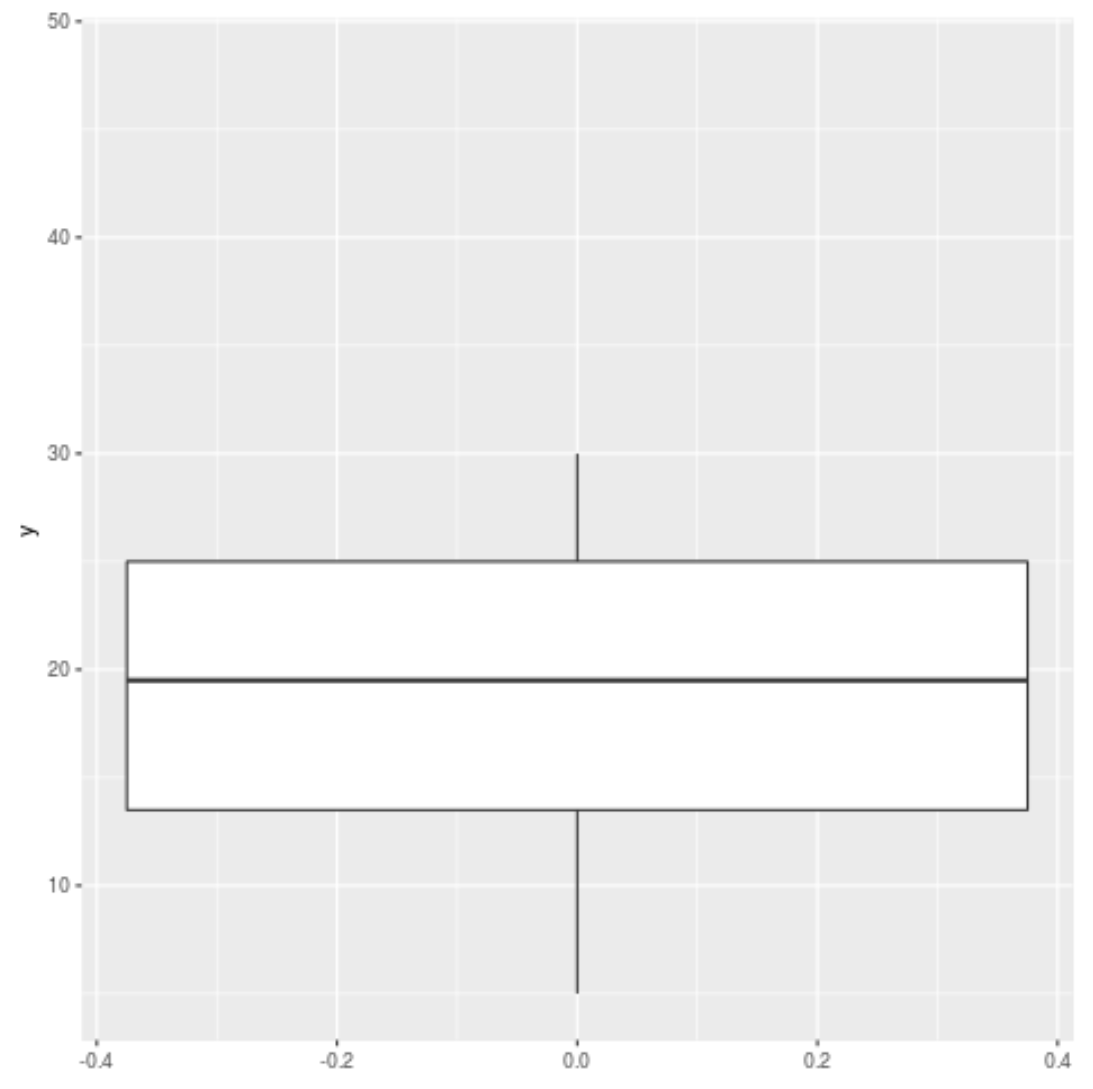
Notice that ggplot2 does not automatically adjust the y-axis.
To adjust the y-axis, you can use coord_cartesian:
ggplot(data, aes(y=y)) +
  geom_boxplot(outlier.shape = NA) +
  coord_cartesian(ylim=c(5, 30))
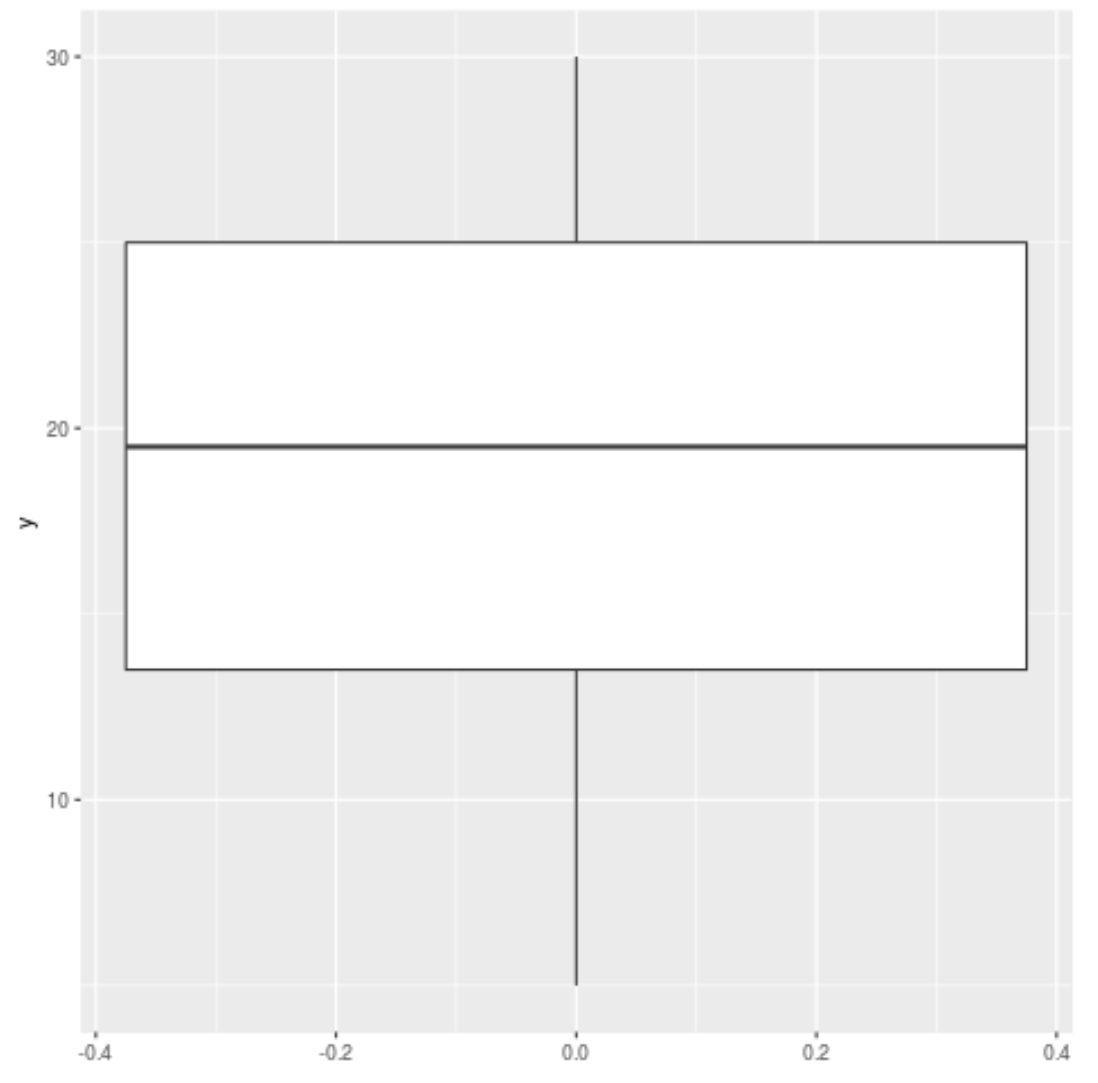
The y-axis now ranges from 5 to 30, just as we specified using the ylim() argument.
Additional Resources
The following tutorials explain how to perform other common operations in ggplot2:
How to Set Axis Limits in ggplot2
How to Create Side-by-Side Plots in ggplot2
How to Label Outliers in Boxplots in ggplot2