R-squared, often written as r2, is a measure of how well a linear regression model fits a dataset.
In technical terms, it is the proportion of the variance in the response variable that can be explained by the predictor variable.
The value for r2 can range from 0 to 1:
- A value of 0 indicates that the response variable cannot be explained by the predictor variable at all.
- A value of 1 indicates that the response variable can be perfectly explained without error by the predictor variable.
Related: What is a Good R-squared Value?
This tutorial explains how to calculate r2 for two variables in Excel.
Example: Calculating R-Squared in Excel
Suppose we have the following data for the number of hours studied and the exam score received for 20 students:
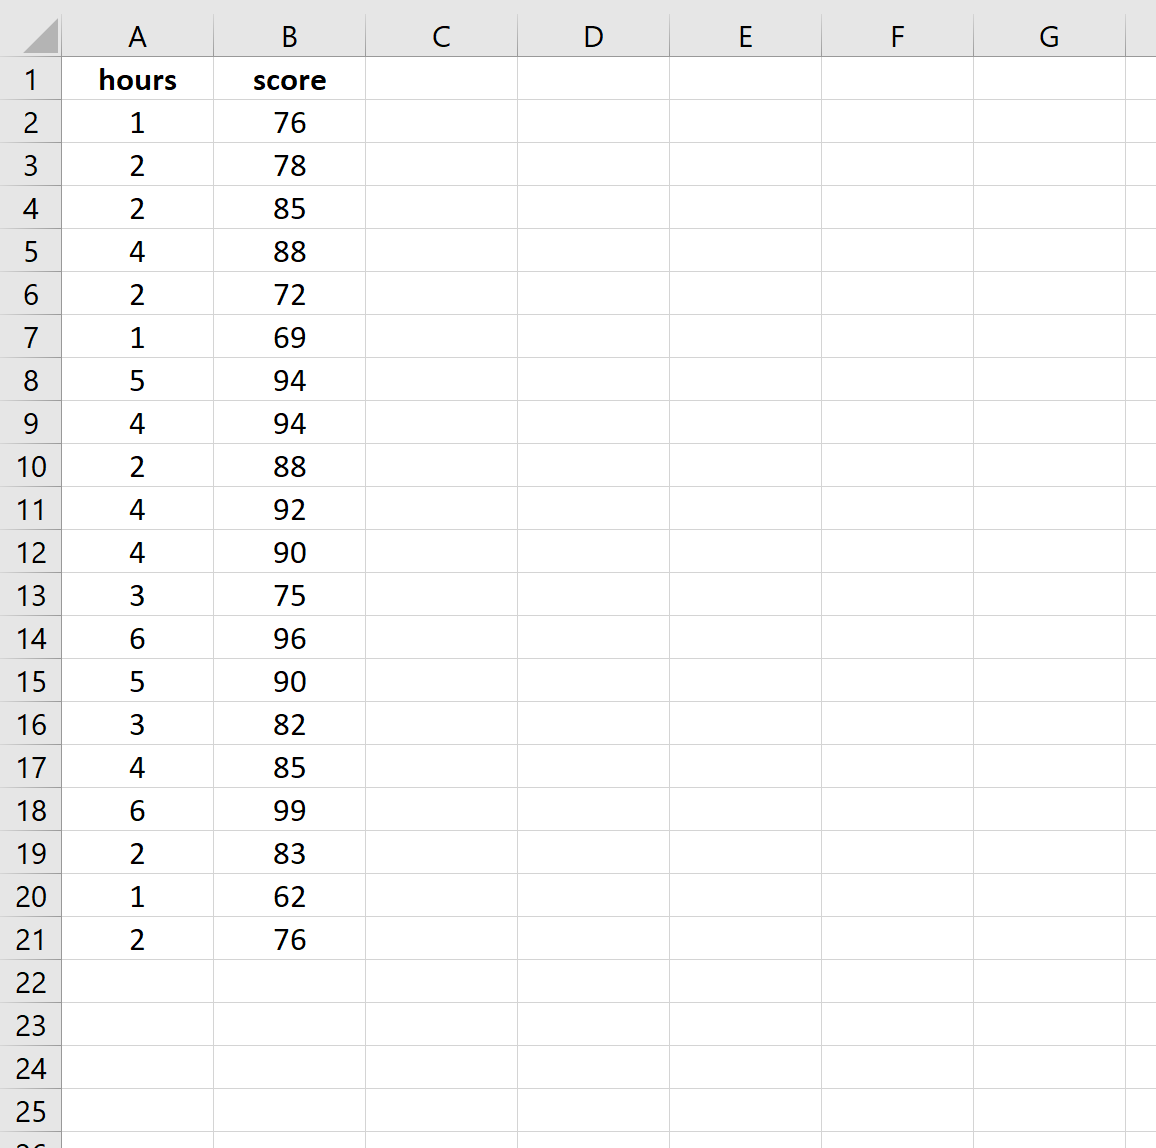
Now suppose we are interested in fitting a simple linear regression model to this data, using “hours” as the predictor variable and “score” as the response variable.
To find the r2 for this data, we can use the RSQ() function in Excel, which uses the following syntax:
=RSQ(known_ys, known_xs)
where:
- known_ys: the values for the response variable
- known_xs: the values for the predictor variable
Here’s what that formula looks like in our example:
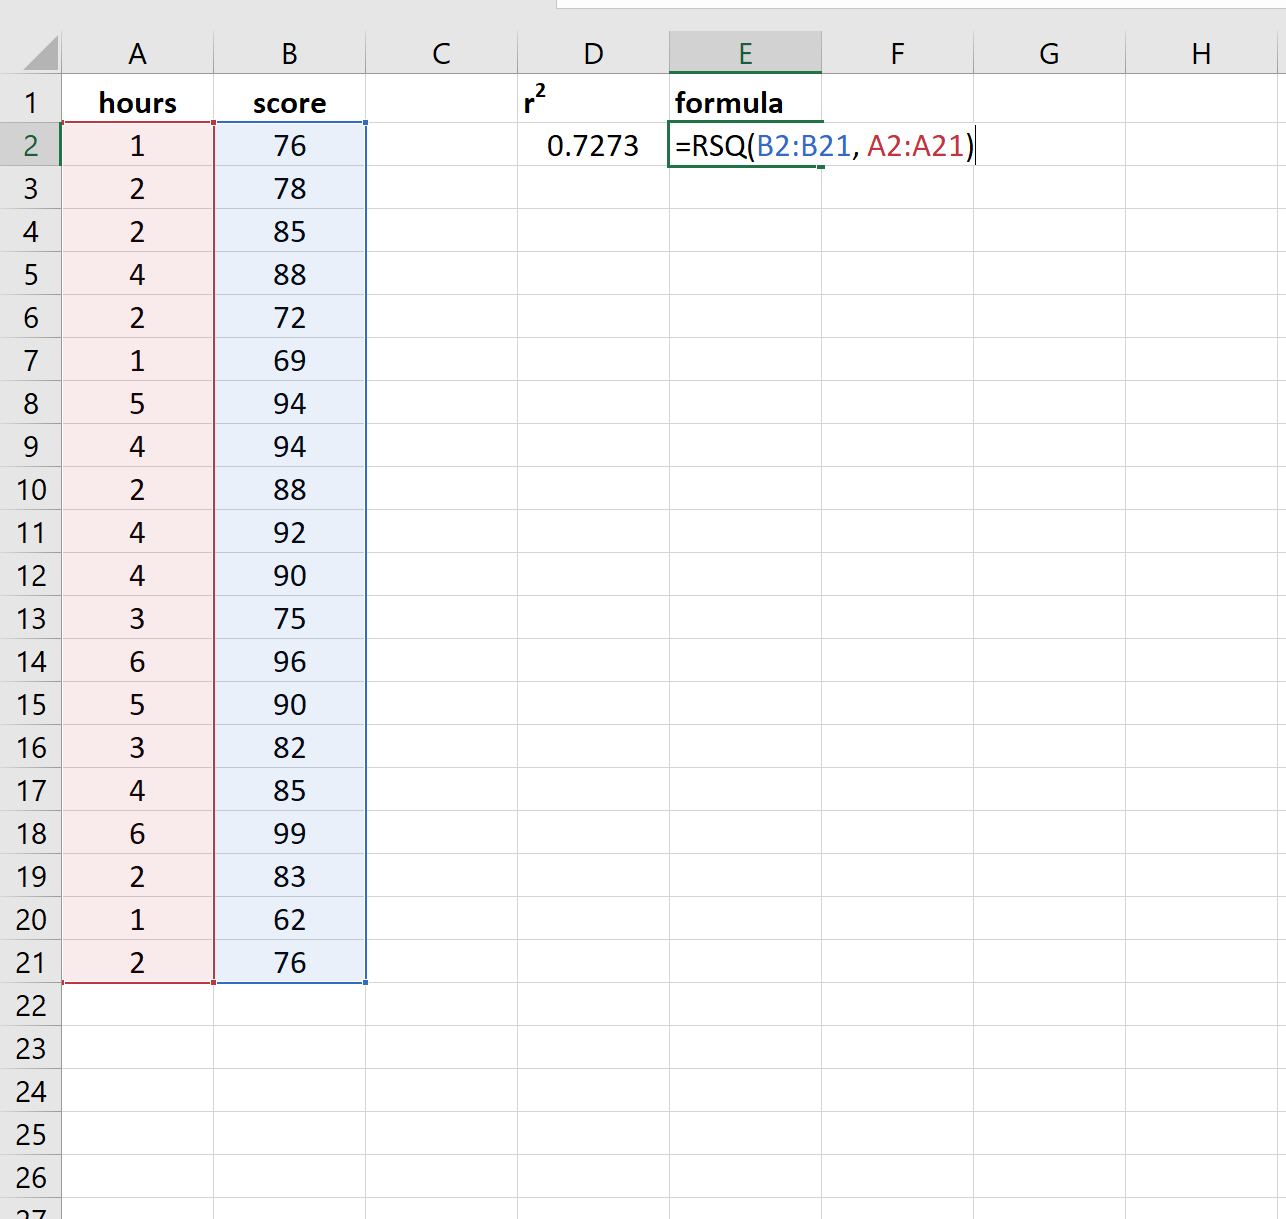
In this example, 72.73% of the variation in the exam scores can be explained by the number of hours studied.
Note that if we fit a simple linear regression model to this data, the output would look like this:
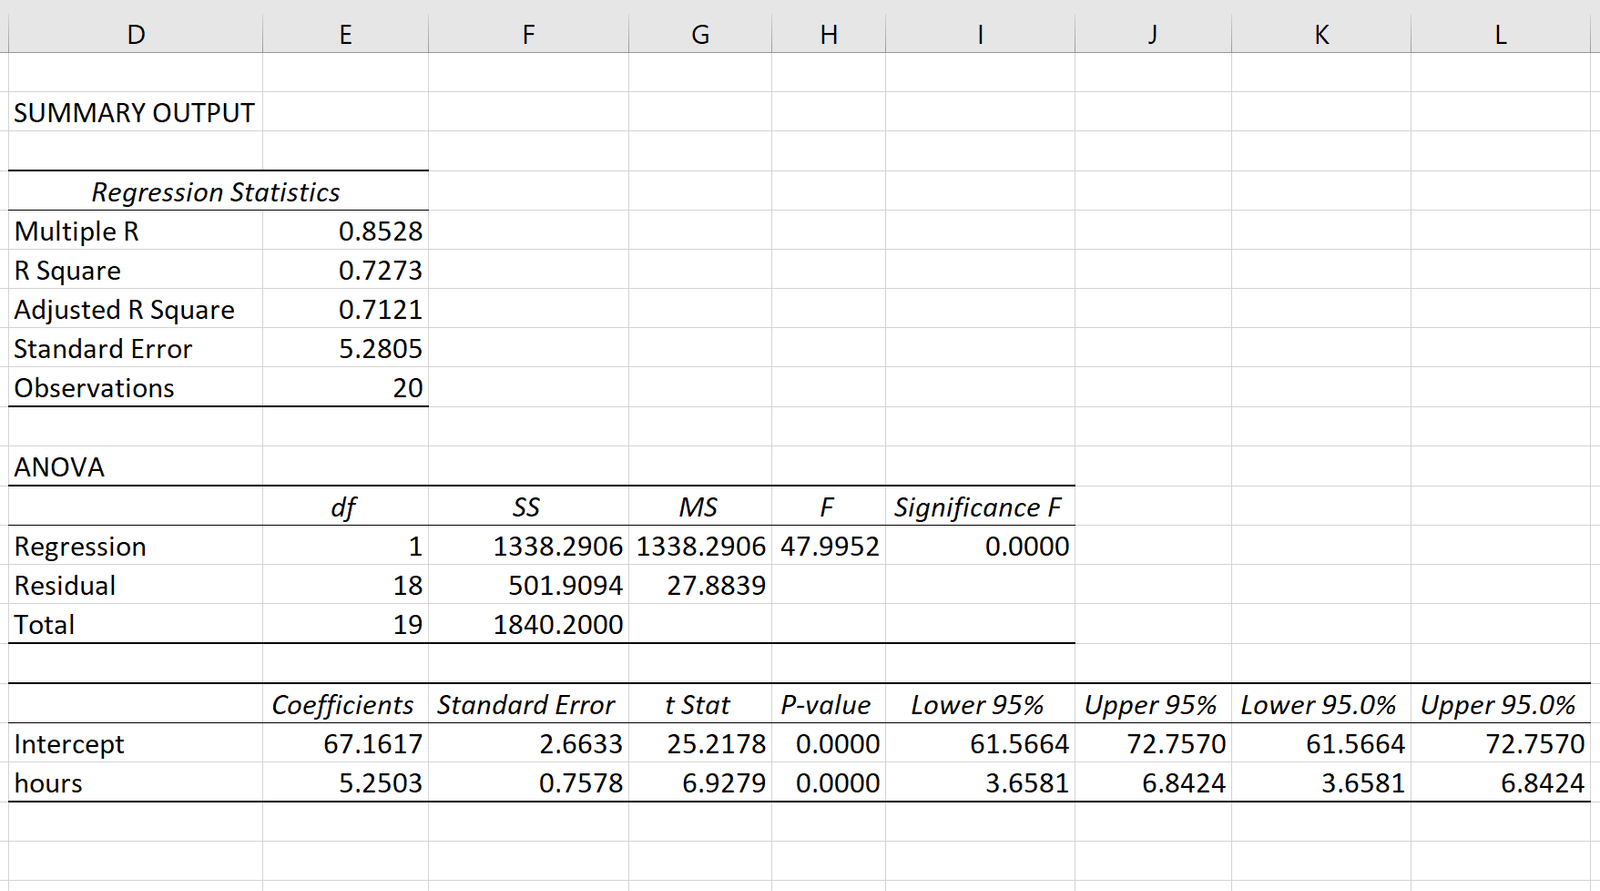
Notice that the R Square value in the first table is 0.7273, which matches the result that we got using the RSQ() function.
Additional Resources
The following tutorials explain how to perform other common tasks in Excel:
How to Calculate Adjusted R-Squared in Excel
How to Calculate SST, SSR, and SSE in Excel
How to Create a Residual Plot in Excel