R-squared, often written R2, is the proportion of the variance in the response variable that can be explained by the predictor variables in a linear regression model.
The value for R-squared can range from 0 to 1. A value of 0 indicates that the response variable cannot be explained by the predictor variable at all while a value of 1 indicates that the response variable can be perfectly explained without error by the predictor variables.
The adjusted R-squared is a modified version of R-squared that adjusts for the number of predictors in a regression model. It is calculated as:
Adjusted R2 = 1 – [(1-R2)*(n-1)/(n-k-1)]
where:
- R2: The R2 of the model
- n: The number of observations
- k: The number of predictor variables
Because R2 always increases as you add more predictors to a model, adjusted R2 can serve as a metric that tells you how useful a model is, adjusted for the number of predictors in a model.
This tutorial provides a step-by-step example of how to calculate adjusted R2 for a regression model in R.
Step 1: Create the Data
For this example, we’ll create a dataset that contains the following variables for 12 different students:
- Exam Score
- Hours Spent Studying
- Current Grade

Step 2: Fit the Regression Model
Next, we’ll fit a multiple linear regression model using Exam Score as the response variable and Study Hours and Current Grade as the predictor variables.
To fit this model, click the Data tab along the top ribbon and then click Data Analysis:
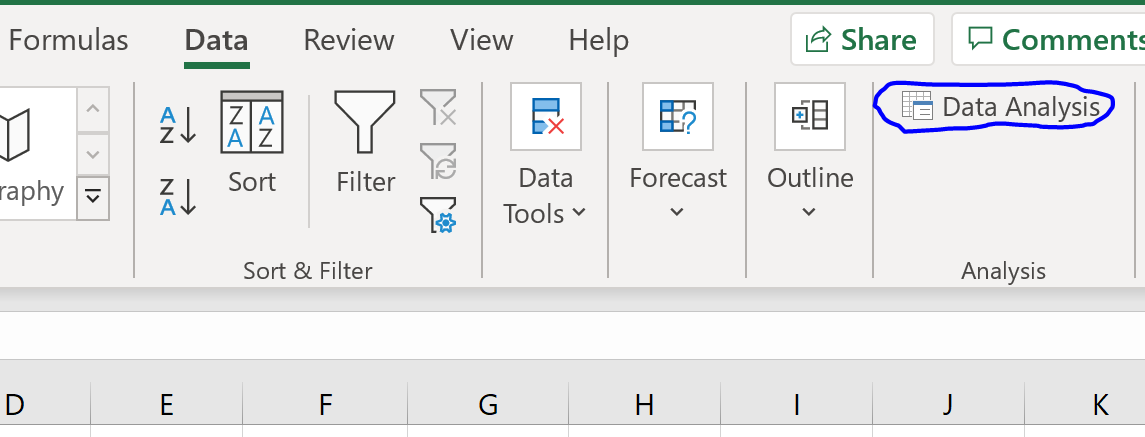
If you don’t see this option available, you need to first load the Data Analysis ToolPak.
In the window that pops up, select Regression. In the new window that appears, fill in the following information:
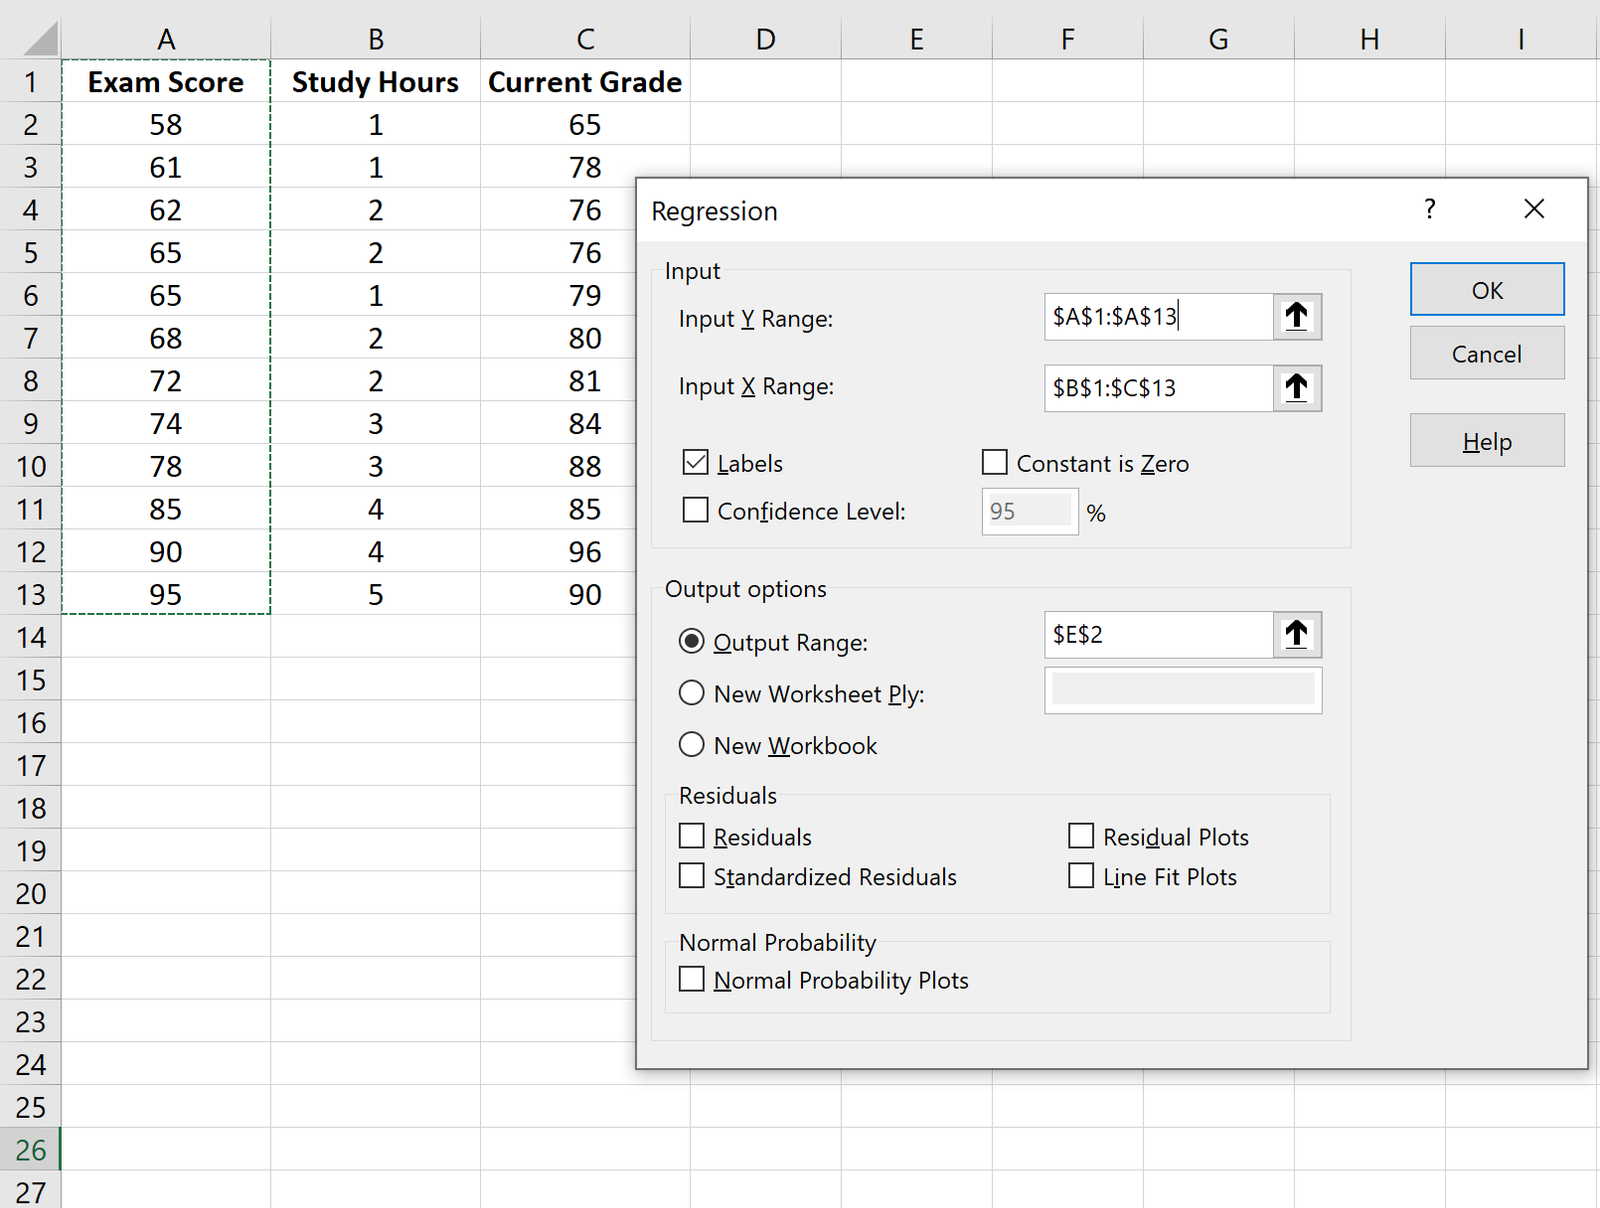
Once you click OK, the output of the regression model will appear:

Step 3: Interpret the Adjusted R-Squared
The adjusted R-squared of the regression model is the number next to Adjusted R Square:
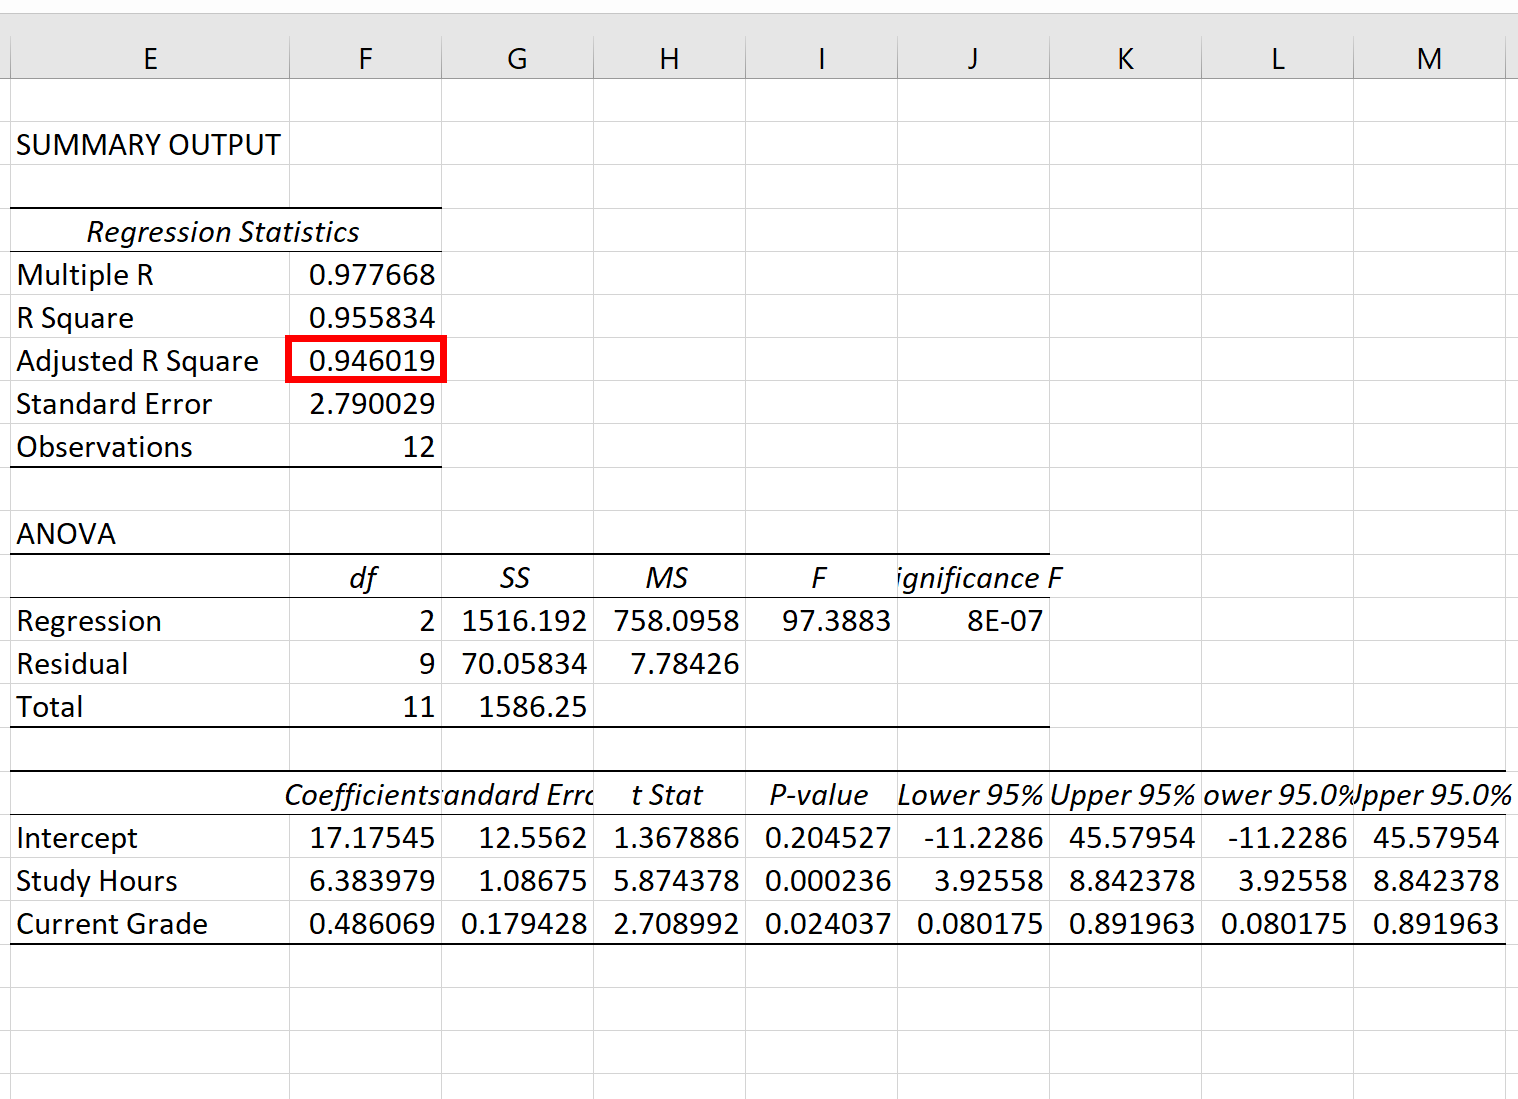
The adjusted R-squared for this model turns out to be 0.946019.
This value is extremely high, which indicates that the predictor variables Study Hours and Current Grade do a good job of predicting Exam Score.
Additional Resources
What is a Good R-squared Value?
How to Calculate Adjusted R-Squared in R
How to Calculate Adjusted R-Squared in Python