In statistics, pooled variance refers to the average of two or more group variances.
We use the word “pooled” to indicate that we’re “pooling” two or more group variances to come up with a single number for the common variance between the groups.
In practice, pooled variance is used most often in a two sample t-test, which is used to determine whether or not two population means are equal.
The pooled variance between two samples is typically denoted as sp2 and is calculated as:
sp2 = ( (n1-1)s12 + (n2-1)s22 ) / (n1+n2-2)
This tutorial provides a step-by-step example of how to calculate the pooled variance between two groups in Excel.
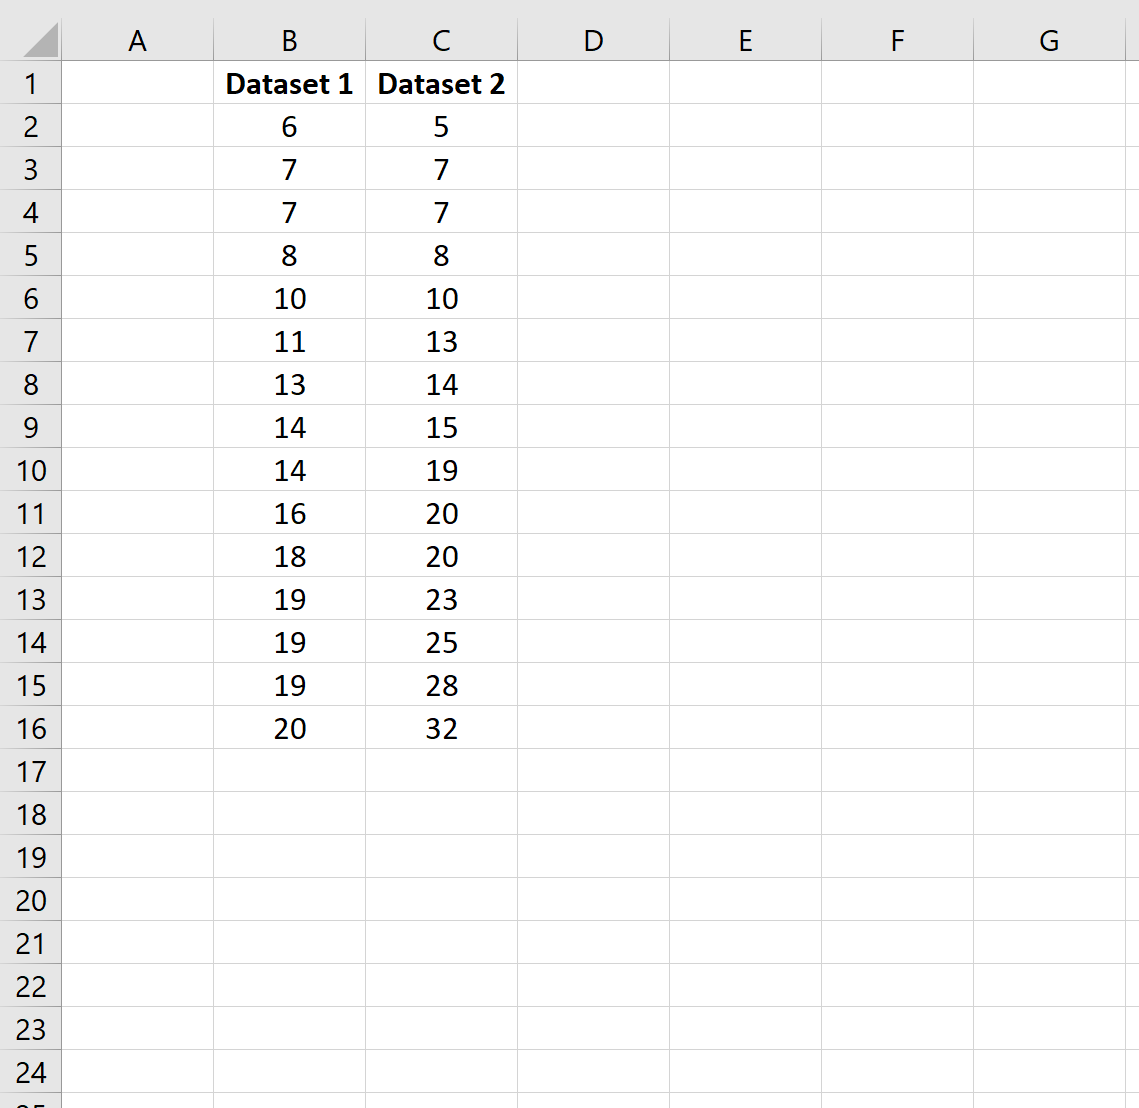
Step 1: Create the Data
First, let’s create two datasets:
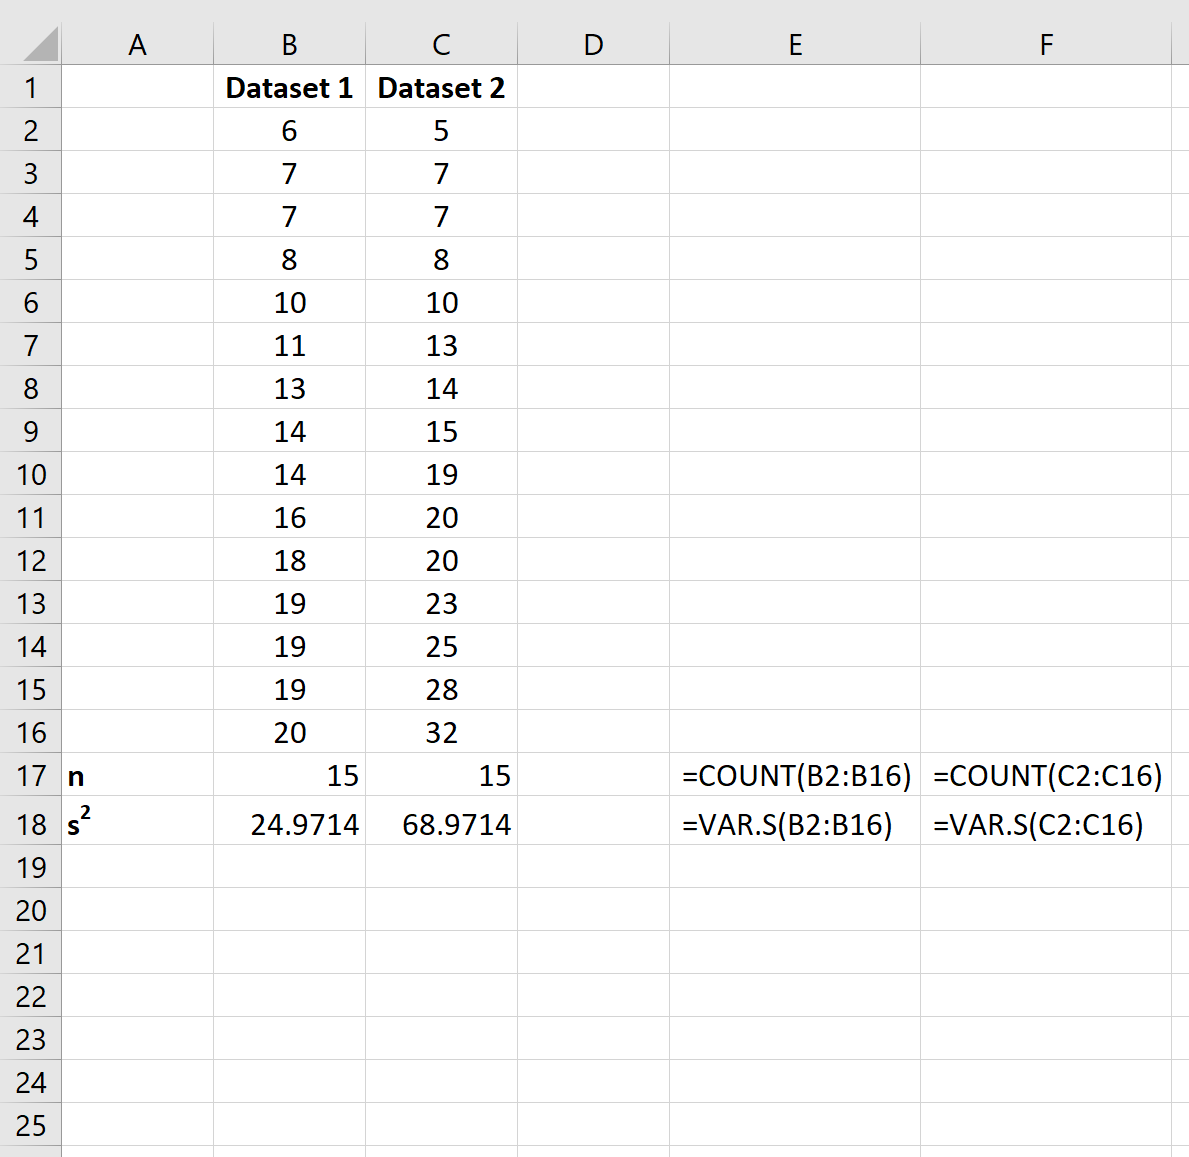
Step 2: Calculate the Sample Size & Sample Variance
Next, let’s calculate the sample size and sample variance for each dataset.
Cells E17:F18 show the formulas we used:
Step 3: Calculate the Pooled Variance
Lastly, we can use the following formula to calculate the pooled variance:
=((B17-1)*B18 + (C17-1)*C18) / (B17+C17-2)
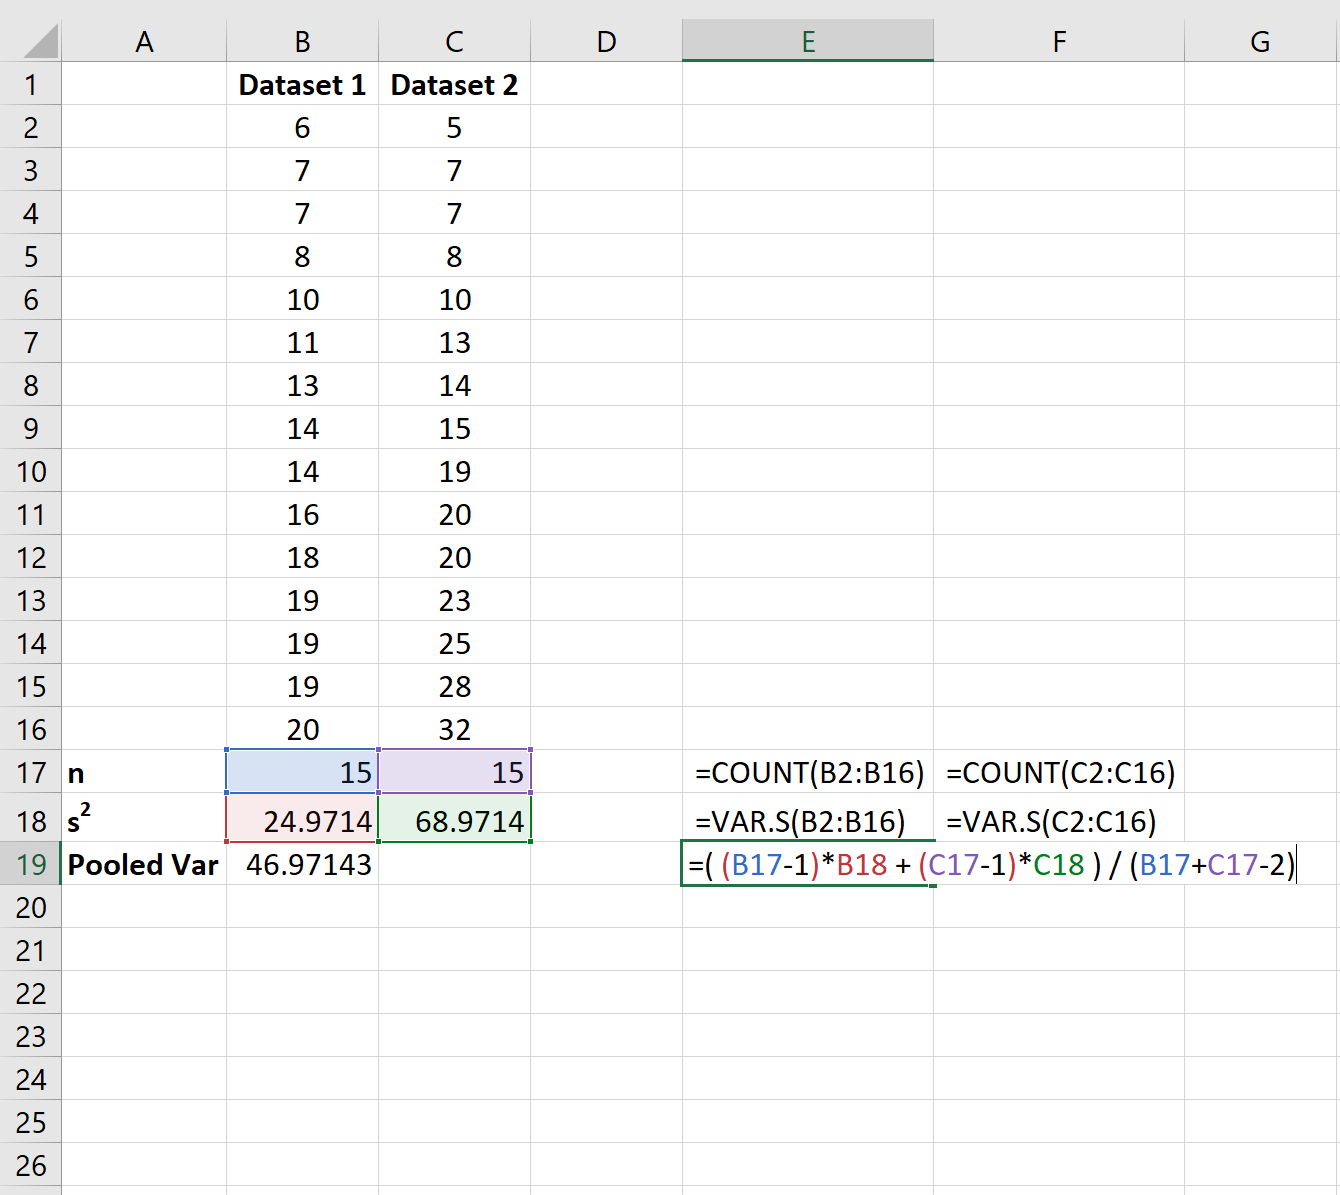
The pooled variance between these two groups turns out to be 46.97.
Bonus: You can use this Pooled Variance Calculator to automatically calculate the pooled variance between two groups.
Additional Resources
How to Conduct a One Sample t-Test in Excel
How to Conduct a Two Sample t-Test in Excel
How to Conduct Welch’s t-test in Excel