A paired samples t-test is used to compare the means of two samples when each observation in one sample can be paired with an observation in the other sample.
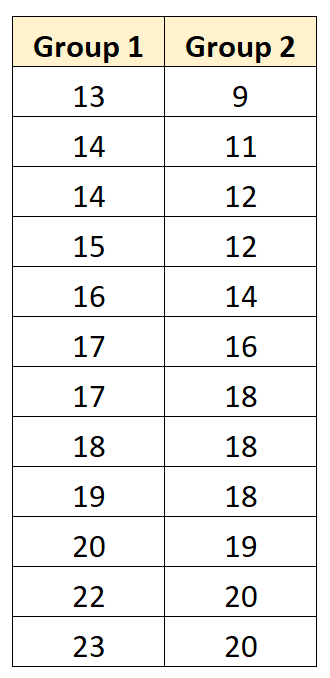
The following step-by-step example shows how to perform a paired samples t-test to determine if the population means are equal between the following two groups:
Step 1: Calculate the Test Statistic
The test statistic of a paired t-test is calculated as:
t = xdiff / (sdiff/√n)
where:
- xdiff: sample mean of the differences
- s: sample standard deviation of the differences
- n: sample size (i.e. number of pairs)
We will calculate the mean of the differences between the two groups and the standard deviation of the differences between the two groups:

Thus, our test statistic can be calculated as:
- t = xdiff / (sdiff/√n)
- t = 1.75 / (1.422/√12)
- t = 4.26
Step 2: Calculate the Critical Value
Next, we need to find the critical value to compare our test statistic to.
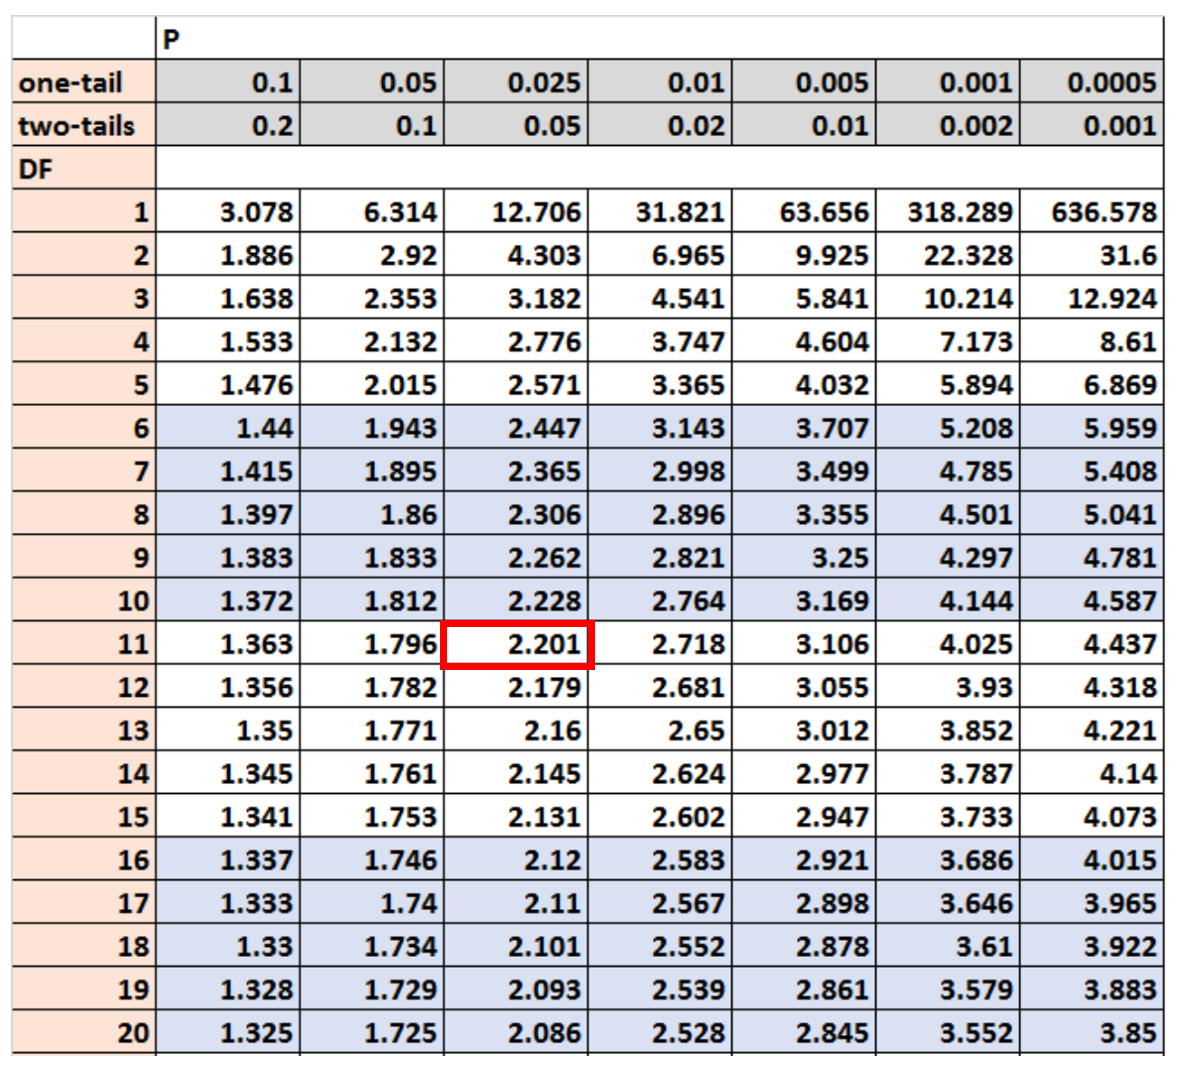
For this example, we’ll use a two-tailed test with α = .05 and df = n-1 degrees of freedom.
According to the t-Distribution table, the critical value that corresponds to these values is 2.201:
Step 3: Reject or Fail to Reject the Null Hypothesis
Our paired samples t-test uses the following null and alternative hypothesis:
- H0: μ1 = μ2 (the two population means are equal)
- HA: μ1 ≠ μ2 (the two population means are not equal)
Since the absolute value of our test statistic (4.26) is greater than the critical value found in the t-table (2.201), we reject the null hypothesis.
This means we have sufficient evidence to say that the mean between the two groups is not equal.
Bonus: Feel free to use the Paired Samples t-test Calculator to confirm your results.