A multinomial test is used to determine if a categorical variable follows a hypothesized distribution.
This test uses the following null and alternative hypotheses:
H0: A categorical variable follows a hypothesized distribution.
HA: A categorical variable does not follow the hypothesized distribution.
If the p-value of the test is less than some significance level (e.g. α = .05) then we can reject the null hypothesis and conclude that the variable does not follow the hypothesized distribution.
This test is used when some variable can take on k different outcomes. A classic example of a multinomial test is when we’d like to determine if some dice is fair. When we roll a dice, the probability that it lands on each number (1 through 6) is 1/6.
To test if a dice is fair, we could roll it a certain number of times and see if the number of times it lands on various numbers is significantly different from what we would expect.
The following examples show how to perform a multinomial test using the statistical programming language R.
Example 1: Fair Dice
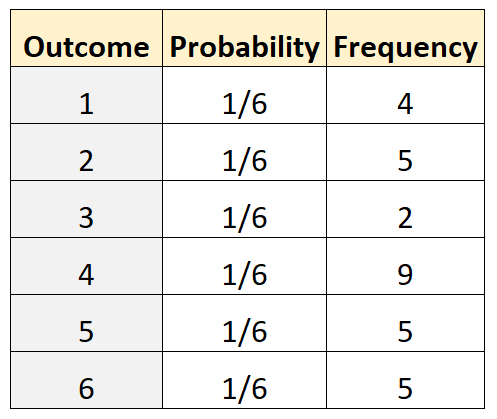
Suppose we would like to determine if a dice is fair. To test this, we roll it 30 times and record the frequency of each outcome. The following table shows the results:
The following code in R can be used to perform a multinomial test:
library(EMT)

#specify probability of each outcome
prob #specify frequency of each outcome from experiment
actual #perform multinomial test
multinomial.test(actual, prob)

 Exact Multinomial Test, distance measure: p

    Events    pObs    p.value
    324632       0     0.4306
The p-value of the test is 0.4306. Since this p-value is not less than .05, we will fail reject the null hypothesis. Thus, we don’t have sufficient evidence to say the dice is unfair.
Example 2: Sales of Products
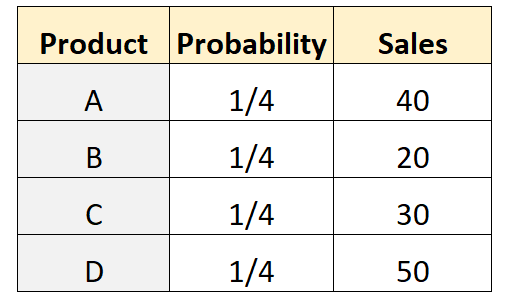
Suppose a shop owner hypothesizes that an equal number of customers will buy each of four different products. To test this, he records the number of customers that buy each product during a given week. The following table shows the results:
The following code in R can be used to perform a multinomial test on this dataset:
library(EMT)

#specify probability of each outcome
prob #specify frequency of each outcome from experiment
actual #perform multinomial test
multinomial.test(actual, prob)

 Exact Multinomial Test, distance measure: p

    Events    pObs    p.value
    477191       0     0.00226
The p-value of the test is 0.00226. Since this p-value is less than .05, we will reject the null hypothesis. Thus, we have sufficient evidence to say that the sales are not equal for each product.
Example 3: Marbles in a Bag
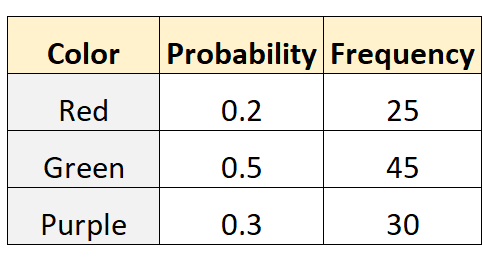
Tom claims that the probability of choosing a red, green, or purple marbles from a bag is 0.2, 0.5, and 0.3, respectively. To test this, his friend Mike reaches in the bag and pulls out a marble (with replacement) 100 different times. The following table shows the results:
The following code in R can be used to perform a multinomial test on this dataset:
library(EMT)

#specify probability of each outcome
prob #specify frequency of each outcome from experiment
actual #perform multinomial test
multinomial.test(actual, prob)

 Exact Multinomial Test, distance measure: p

    Events    pObs    p.value
      5151  0.0037     0.3999
The p-value of the test is 0.3999. Since this p-value is not less than .05, we will fail to reject the null hypothesis. Thus, we have don’t have sufficient evidence to say that the distribution of marbles in the bag is different from the one specified by Tom.
Additional Resources
An Introduction to the Multinomial Distribution
Multinomial Distribution Calculator