You can use the following syntax to hide axes in Matplotlib plots:
import matplotlib.pyplot as plt

#get current axes
ax = plt.gca()

#hide x-axis
ax.get_xaxis().set_visible(False)

#hide y-axis
ax.get_yaxis().set_visible(False)
The following examples show how to use this syntax in practice.
Example 1: Hide X-Axis
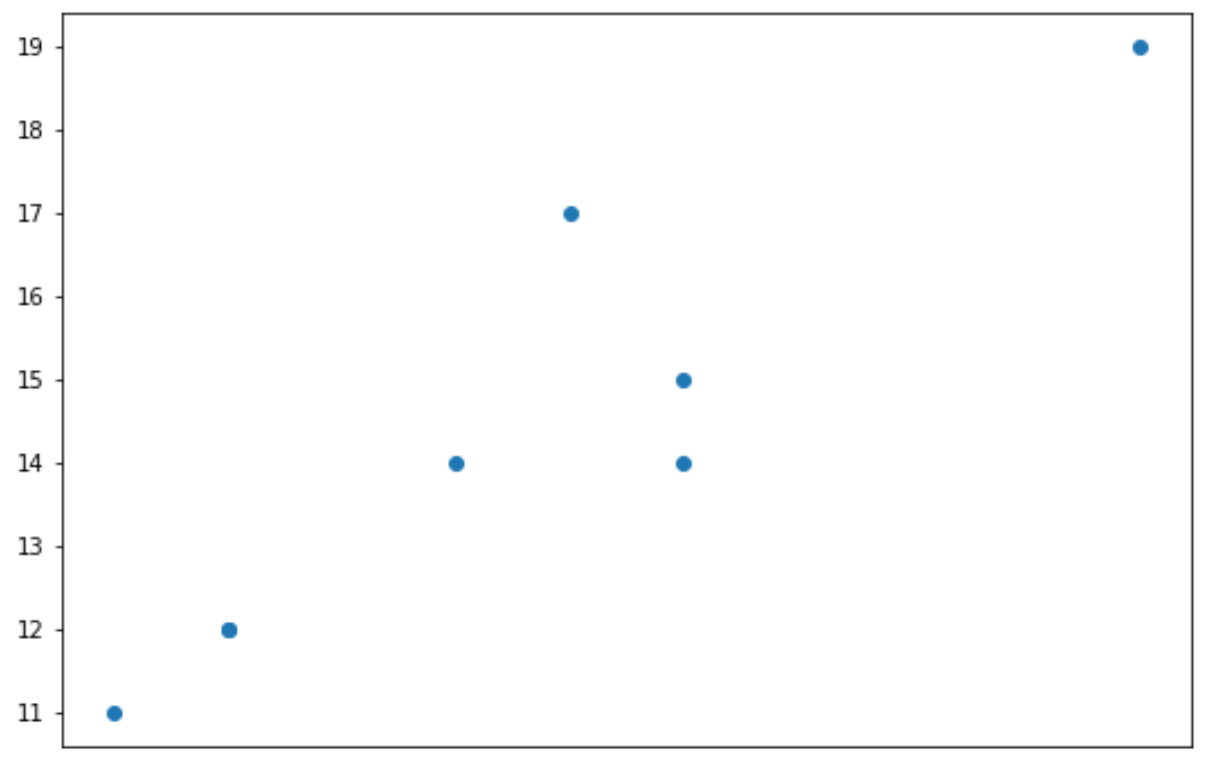
The following code shows how to create a scatterplot and hide the x-axis:
import matplotlib.pyplot as plt

#define data
x = [3, 4, 4, 6, 7, 8, 8, 12]
y = [11, 12, 12, 14, 17, 15, 14, 19]

#create scatterplot
plt.scatter(x, y)

#get current axes
ax = plt.gca()

#hide x-axis
ax.get_xaxis().set_visible(False)
Example 2: Hide Y-Axis
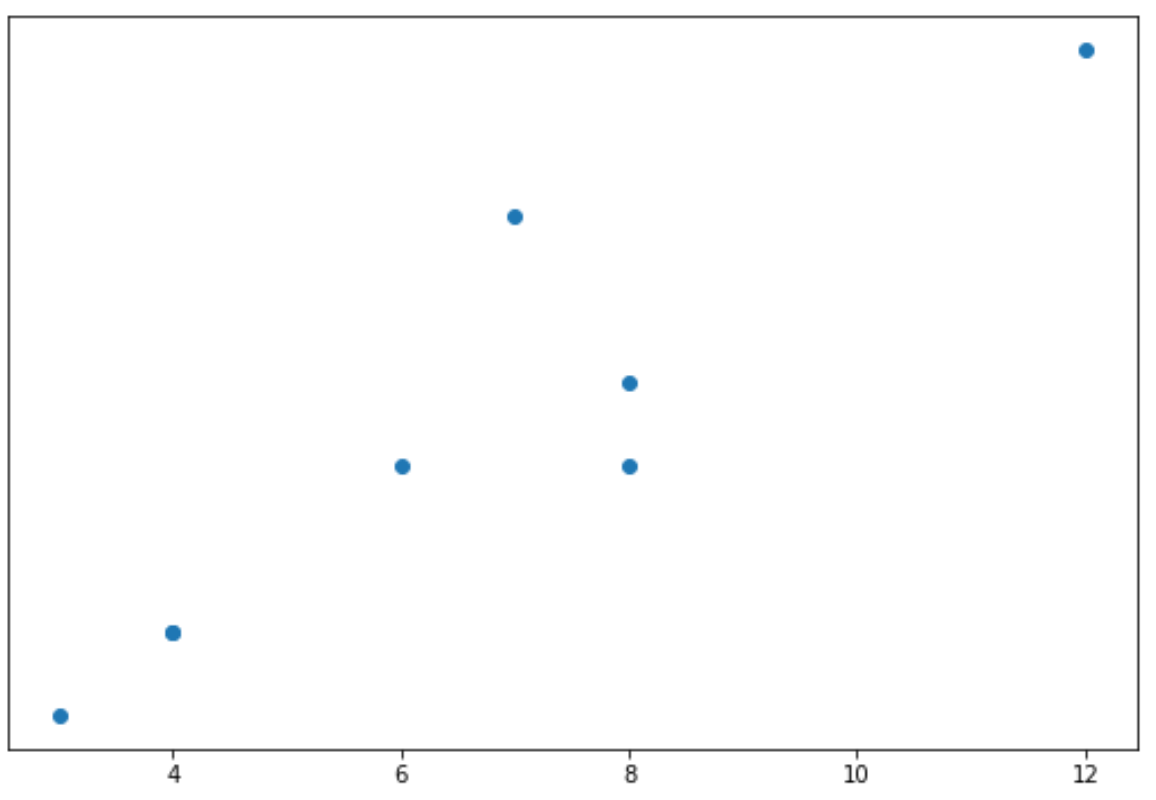
The following code shows how to create a scatterplot and hide the y-axis:
import matplotlib.pyplot as plt

#define data
x = [3, 4, 4, 6, 7, 8, 8, 12]
y = [11, 12, 12, 14, 17, 15, 14, 19]

#create scatterplot
plt.scatter(x, y)

#get current axes
ax = plt.gca()

#hide y-axis
ax.get_yaxis().set_visible(False)
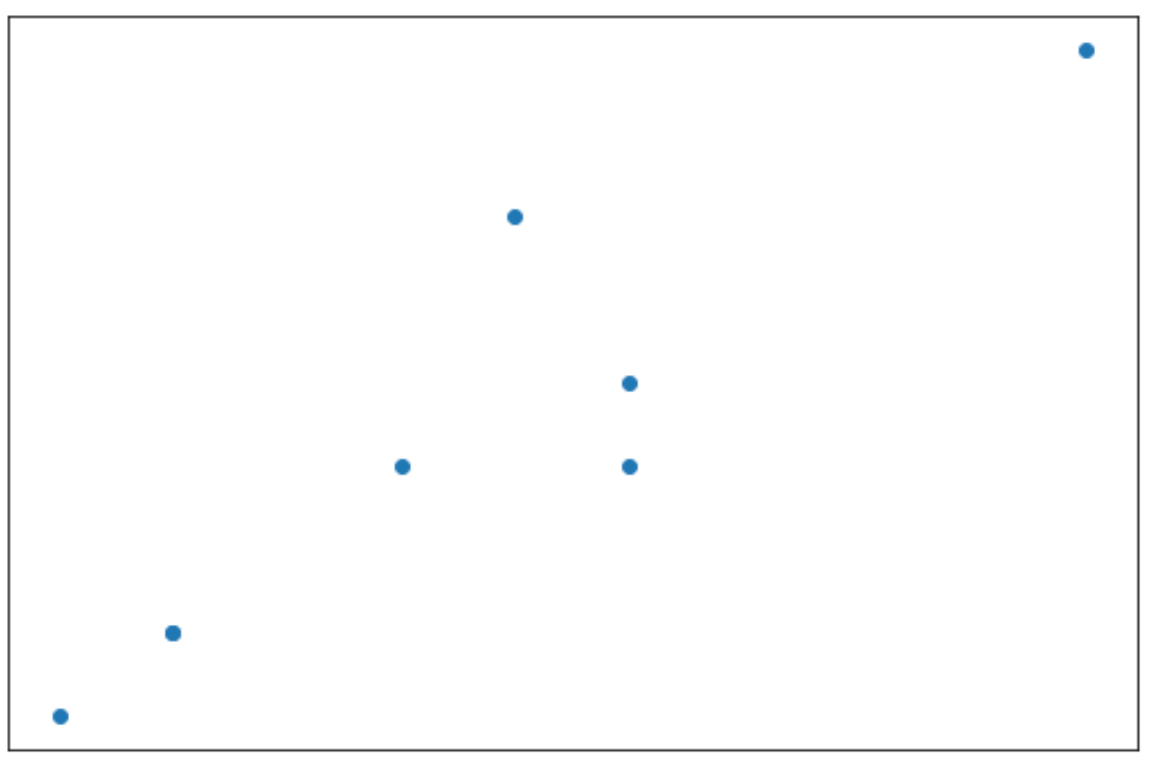
Example 3: Hide Both Axes
The following code shows how to create a scatterplot and hide both axes:
import matplotlib.pyplot as plt

#define data
x = [3, 4, 4, 6, 7, 8, 8, 12]
y = [11, 12, 12, 14, 17, 15, 14, 19]

#create scatterplot
plt.scatter(x, y)

#get current axes
ax = plt.gca()

#hide x-axis
ax.get_xaxis().set_visible(False)

#hide y-axis
ax.get_yaxis().set_visible(False)
Example 4: Remove Axes & Borders Completely
The following code shows how to remove the axes and the plot borders completely:
import matplotlib.pyplot as plt

#define data
x = [3, 4, 4, 6, 7, 8, 8, 12]
y = [11, 12, 12, 14, 17, 15, 14, 19]

#create scatterplot
plt.scatter(x, y)

#get current axes
ax = plt.gca()

#hide axes and borders
plt.axis('off')

Additional Resources
How to Change the Number of Ticks in Matplotlib
How to Rotate Tick Labels in Matplotlib
How to Set Axis Ranges in Matplotlib