Frequencies tell us how often different values occur in a dataset.
We can easily calculate frequencies in Google Sheets by using the FREQUENCY() function, which has the following syntax:
FREQUENCY(data, classes)
where:
- data: Array containing data values
- classes: Array containing a set of classes
The following examples show how to calculate frequencies and relative frequencies in Google Sheets.
Calculating Frequencies in Google Sheets
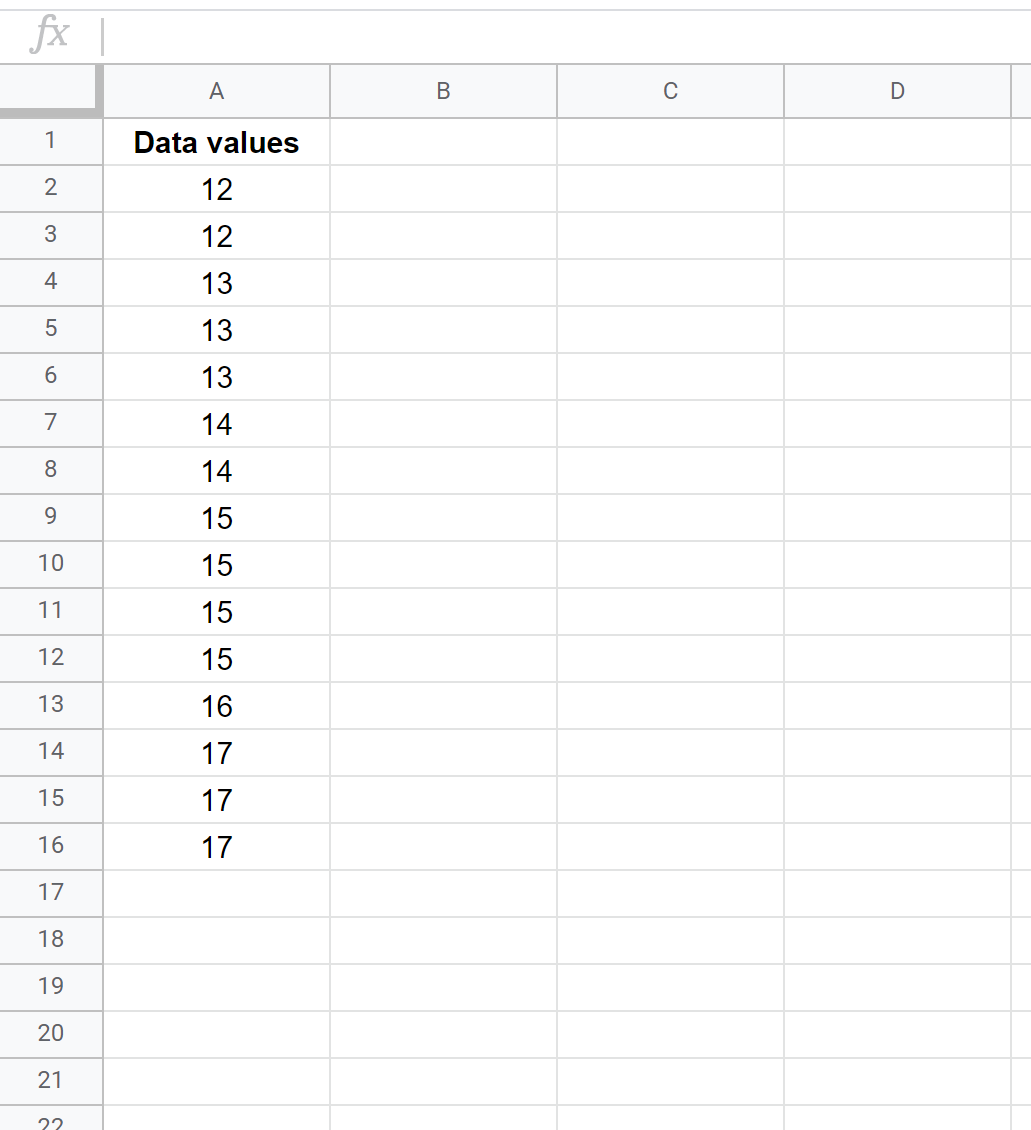
Suppose we have the following dataset with 15 values in Google Sheets:
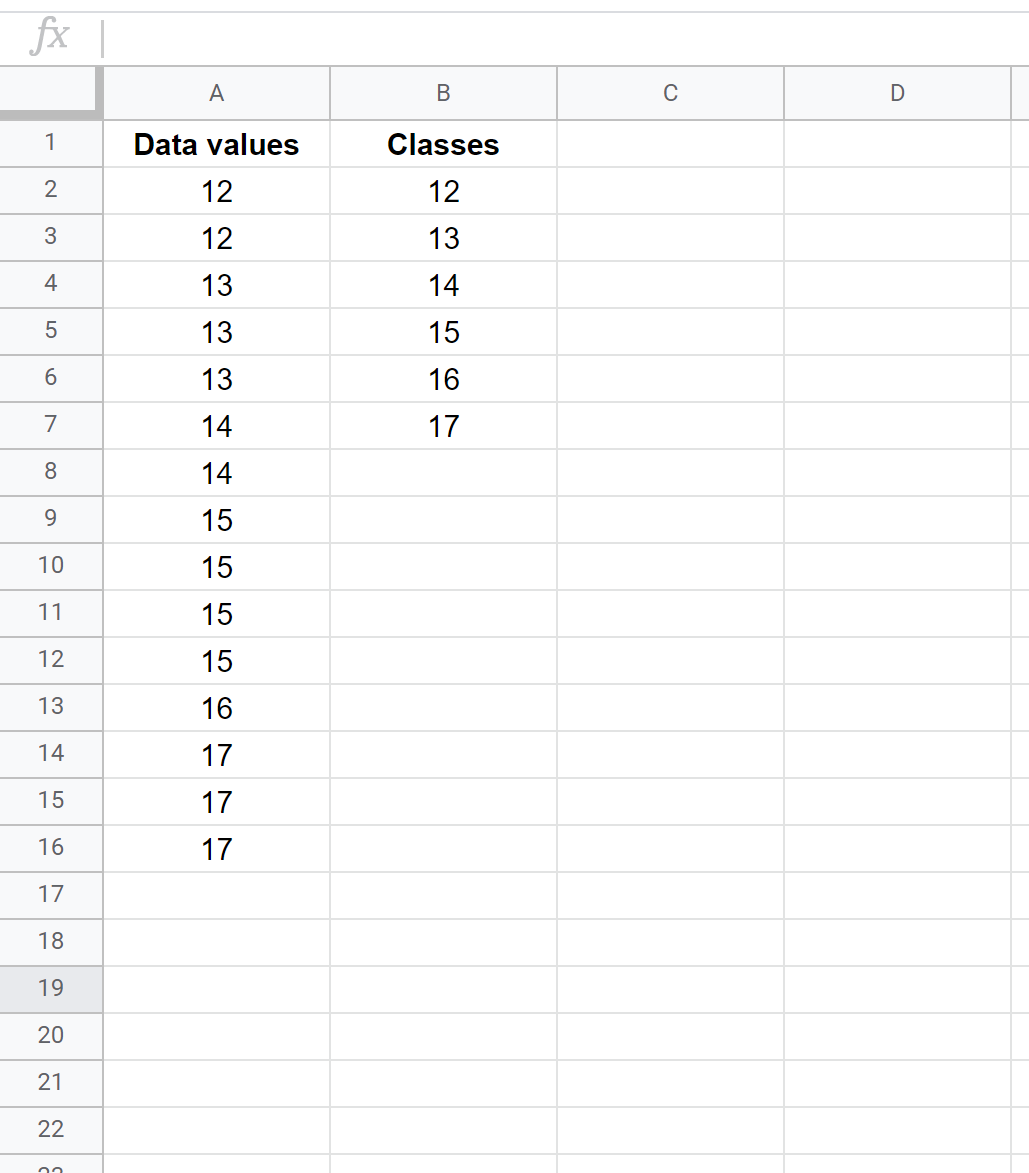
To calculate the frequency of each individual value (e.g. count how many 12’s occur, how many 13’s occur, etc.) we need to first define the classes in column B. We can easily do this by typing the following formula in cell B2:
=SORT(UNIQUE(A2:A16))
This produces the following results:
Next, we can type the following formula into cell C2:
=FREQUENCY(A2:A16, B2:B7)
This produces the following results:
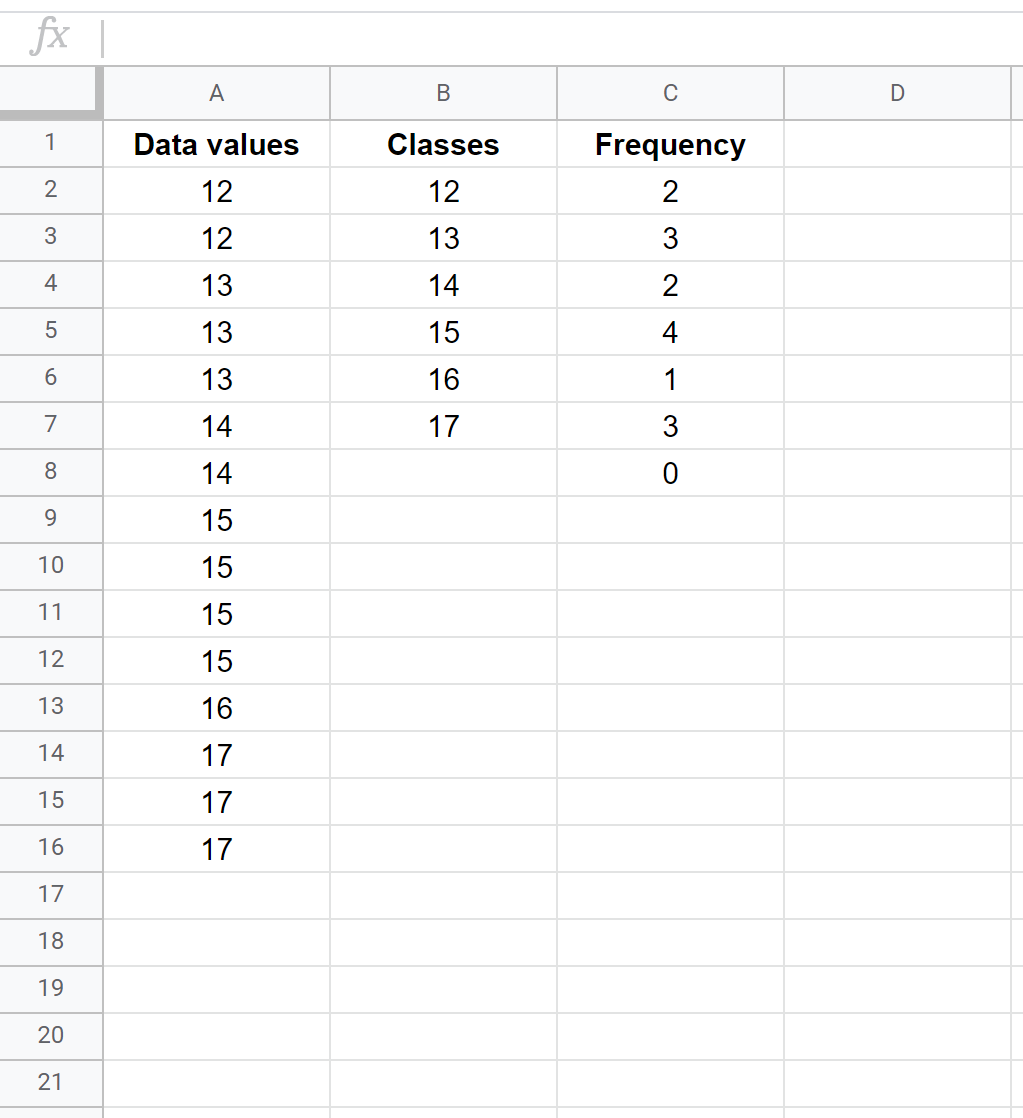
The way to interpret this output is as follows:
- The value 12 occurs in the original dataset 2 times.
- The value 13 occurs in the original dataset 3 times.
- The value 14 occurs in the original dataset 2 times.
- The value 15 occurs in the original dataset 4 times.
- The value 16 occurs in the original dataset 1 time.
- The value 17 occurs in the original dataset 3 times.
Calculating Relative Frequencies in Google Sheets
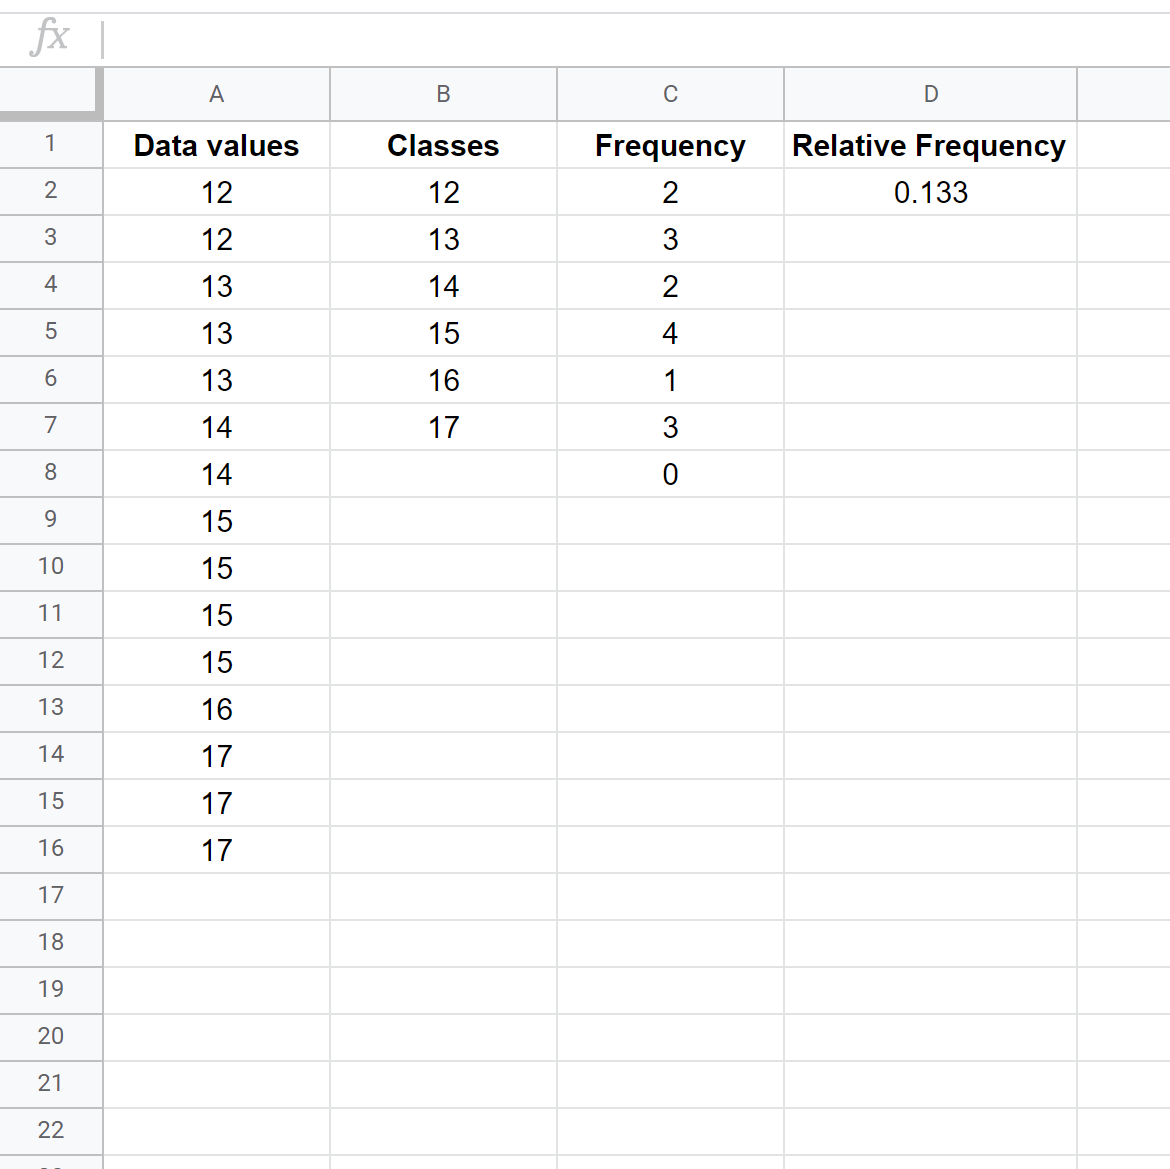
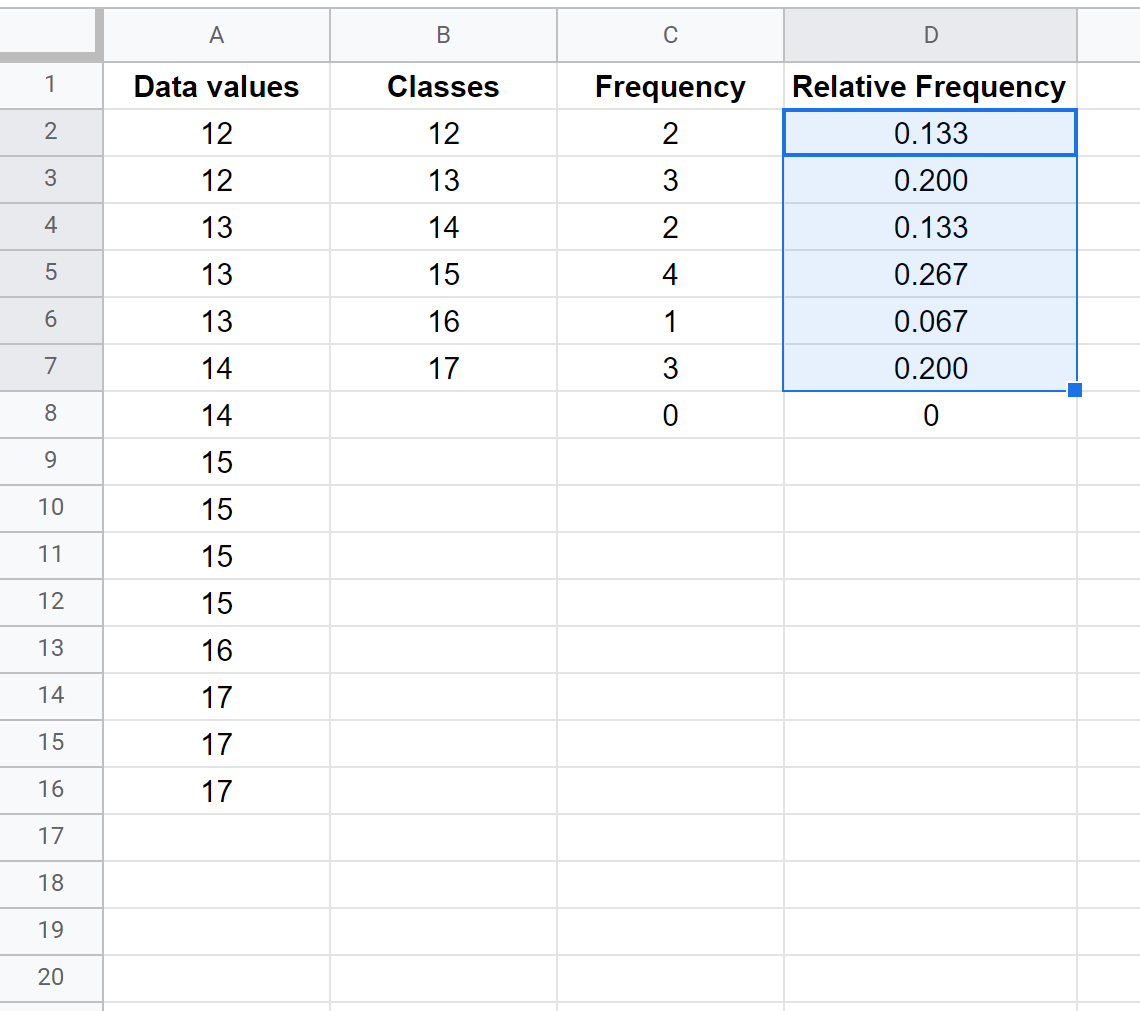
Once we have calculated the frequencies of each individual data value, we can then calculate the relative frequencies of each value by typing the following formula into cell D2:
=C2/COUNT($A$2:$A$16)
This formula calculates the relative frequency of the value 12 in the original dataset:
Once we’ve calculated this relative frequency, we can hover the mouse over the bottom right corner of cell D2 until a small + appears. Double click the + to copy the formula down to the remaining cells:

The way to interpret this output is as follows:
- The value 12 accounts for 0.133 (or 13.3%) of all values in the dataset.
- The value 13 accounts for 0.200 (or 20.0%) of all values in the dataset.
And so on.
You’ll notice that the sum of all of the relative frequencies is equal to 1 (or 100%).
Visualizing Relative Frequencies in Google Sheets
Lastly, we can visualize the relative frequencies by creating a histogram.
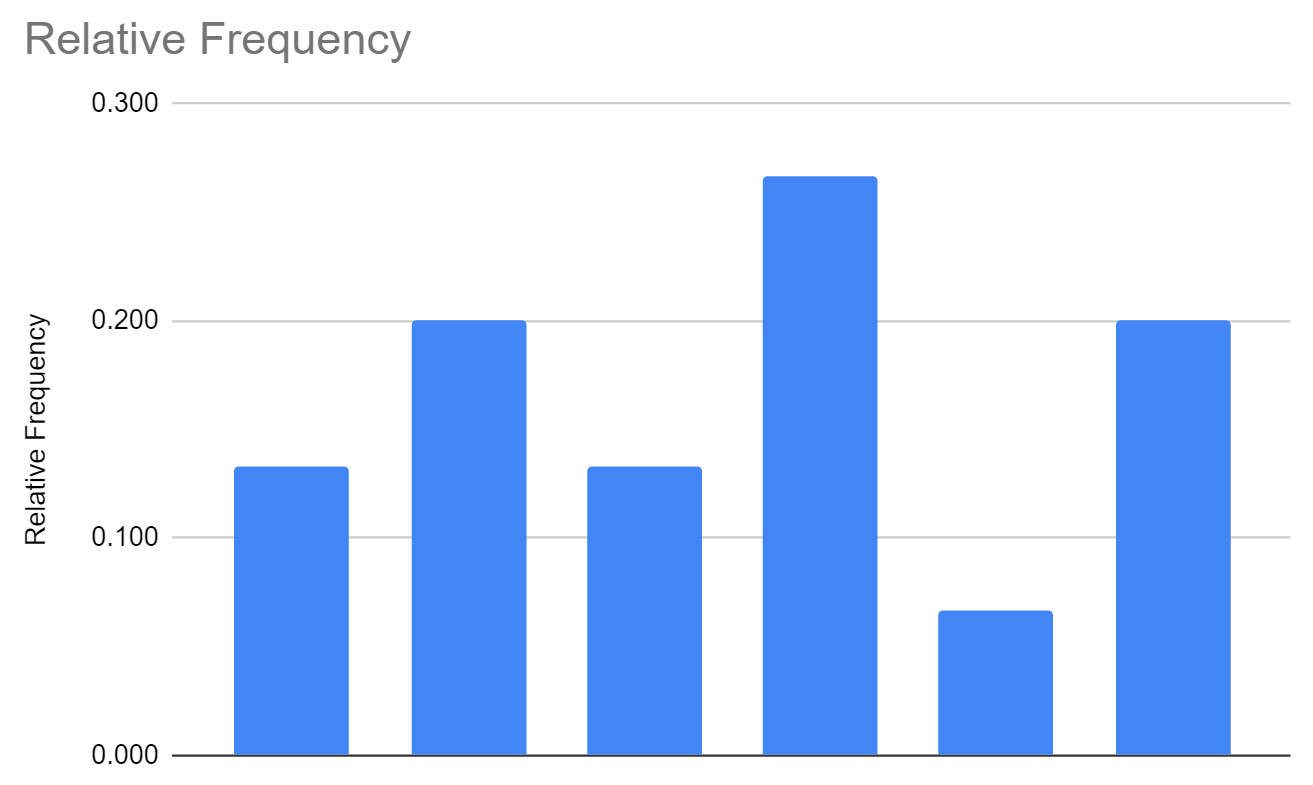
First, highlight the array of relative frequencies:
Next, click the Insert tab along the top ribbon, then click Chart. Google Sheets will automatically produce the following histogram of relative frequencies:
We can easily add x-axis labels by clicking the X-axis input button within the Chart Editor and specifying cells B2:B7 as the labels. This produces the following results:
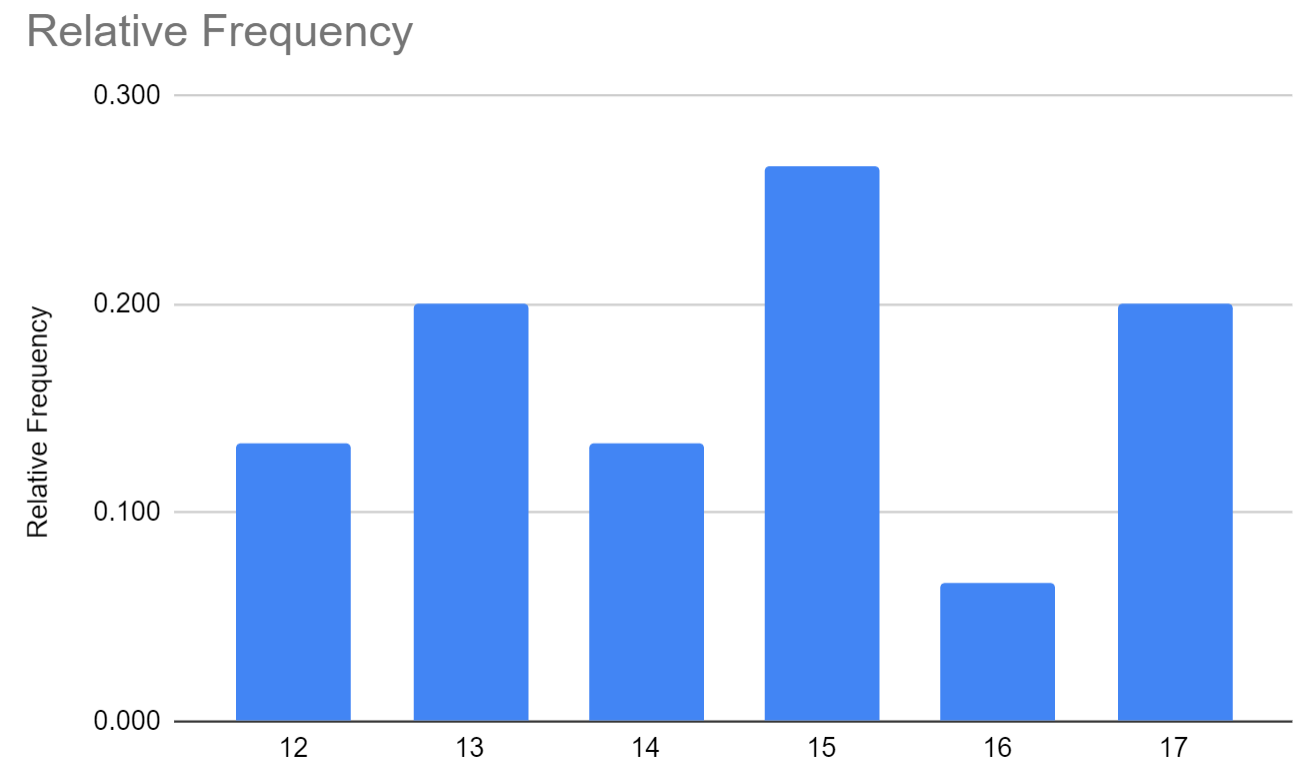
This simple chart helps us quickly understand how often each individual value occurs in the original dataset.