A five number summary is a way to summarize a dataset using the following five values:
- The minimum
- The first quartile
- The median
- The third quartile
- The maximum
The five number summary is useful because it provides a concise summary of the distribution of the data in the following ways:
- It tells us where the middle value is located, using the median.
- It tells us how spread out the data is, using the first and third quartiles.
- It tells us the range of the data, using the minimum and the maximum.
By simply knowing these five values, we can know a great deal about a dataset.
How to Find the Five Number Summary in Excel
We can find the five number summary of a dataset in Excel using the following steps:
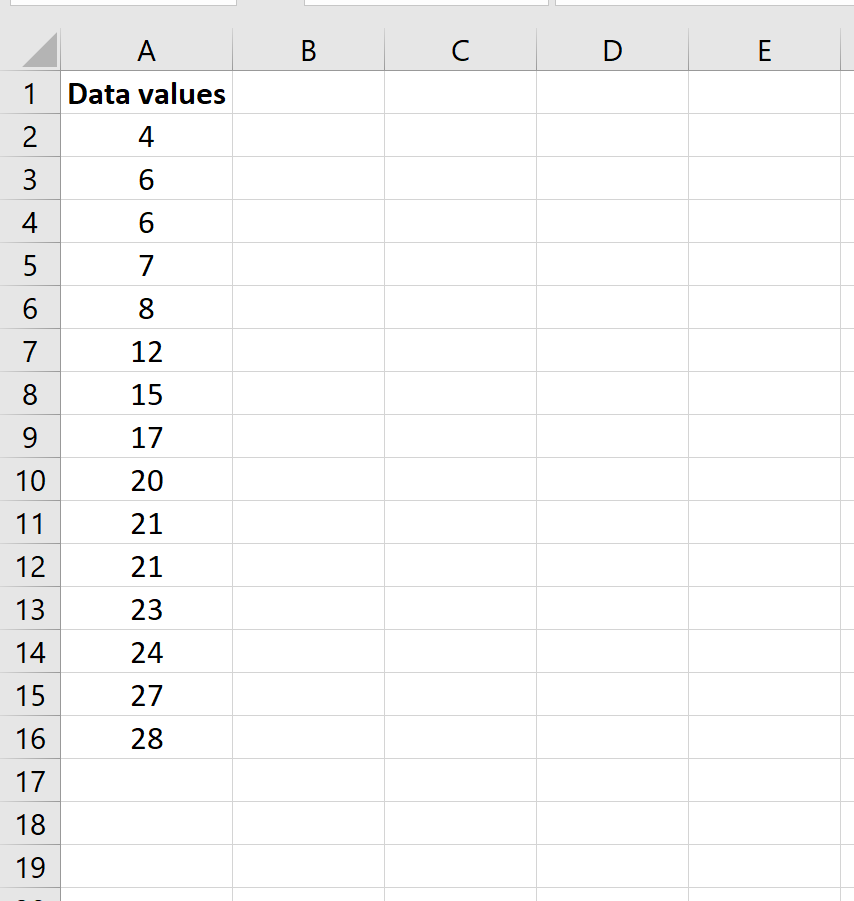
Step 1: Enter the data values in one column.
Step 2: Find the five number summary.
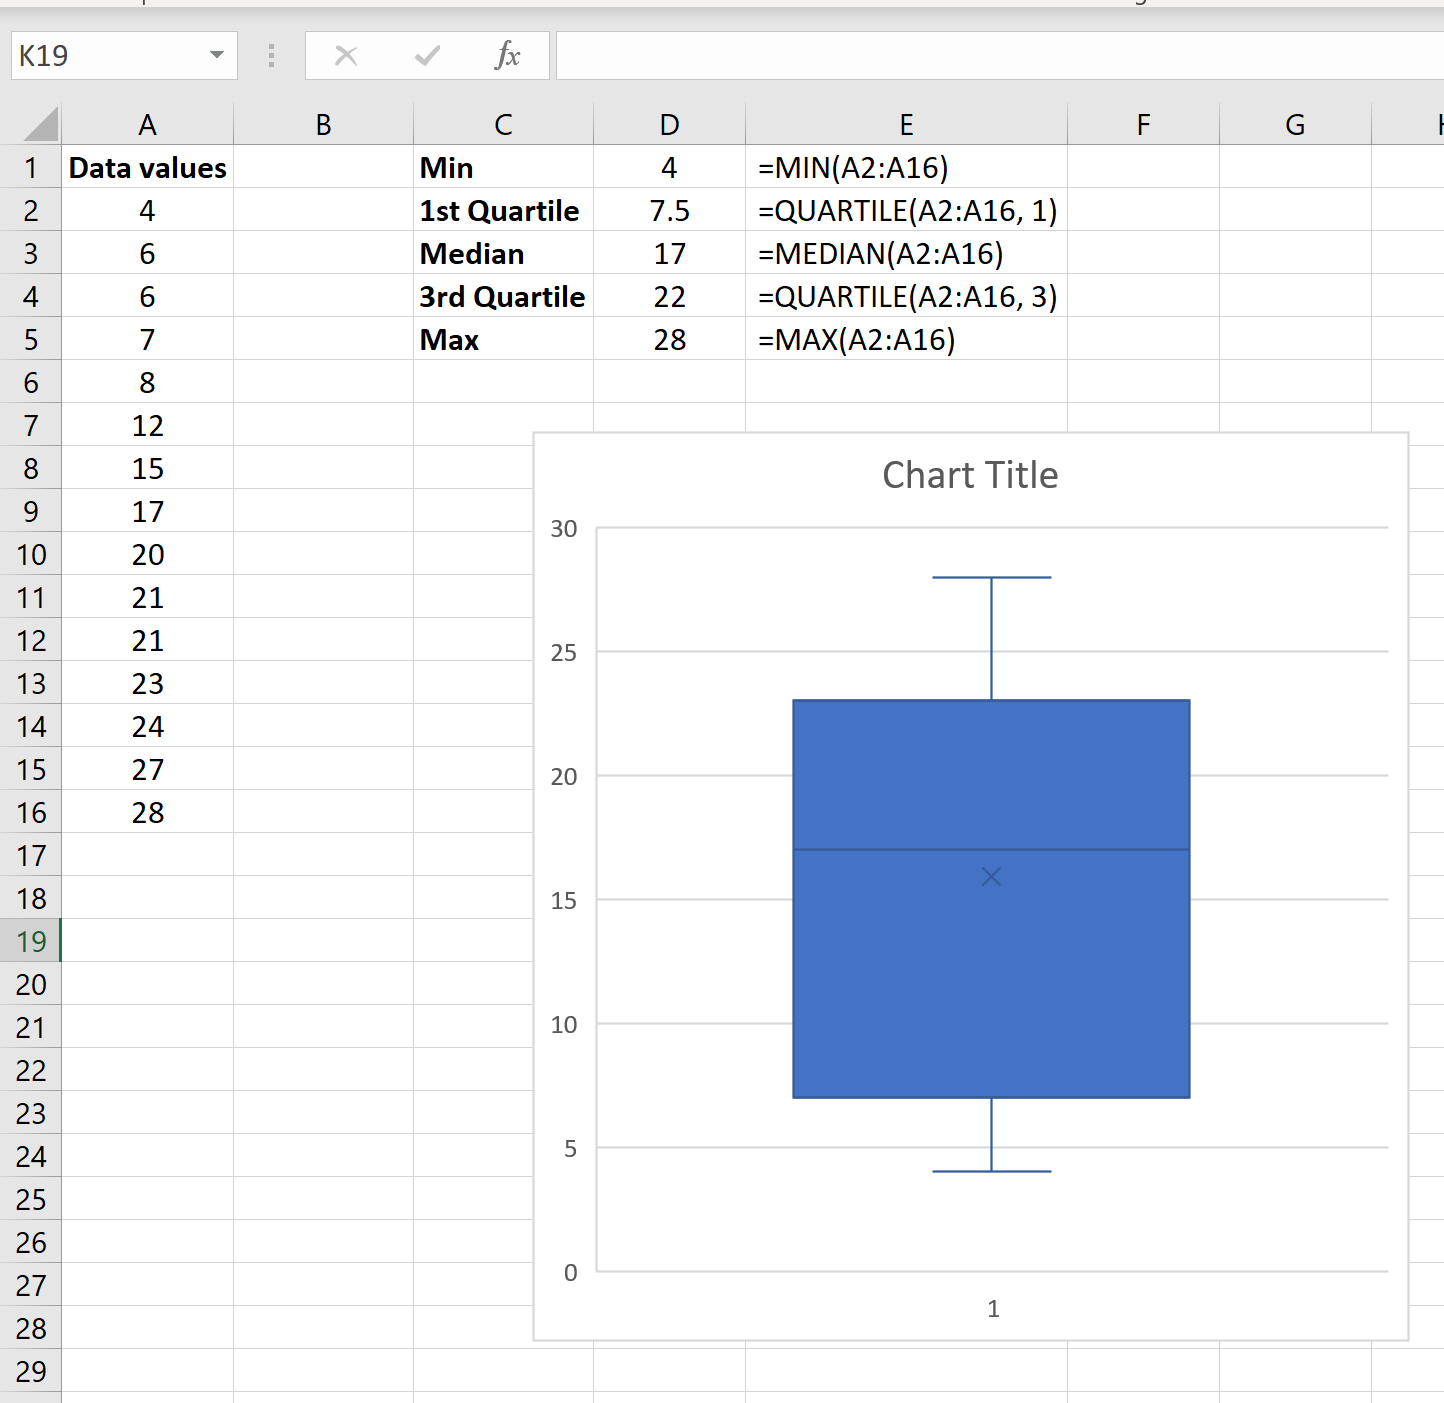
The five values of the five number summary are shown in column D and the formulas used to find these values are shown in column E:
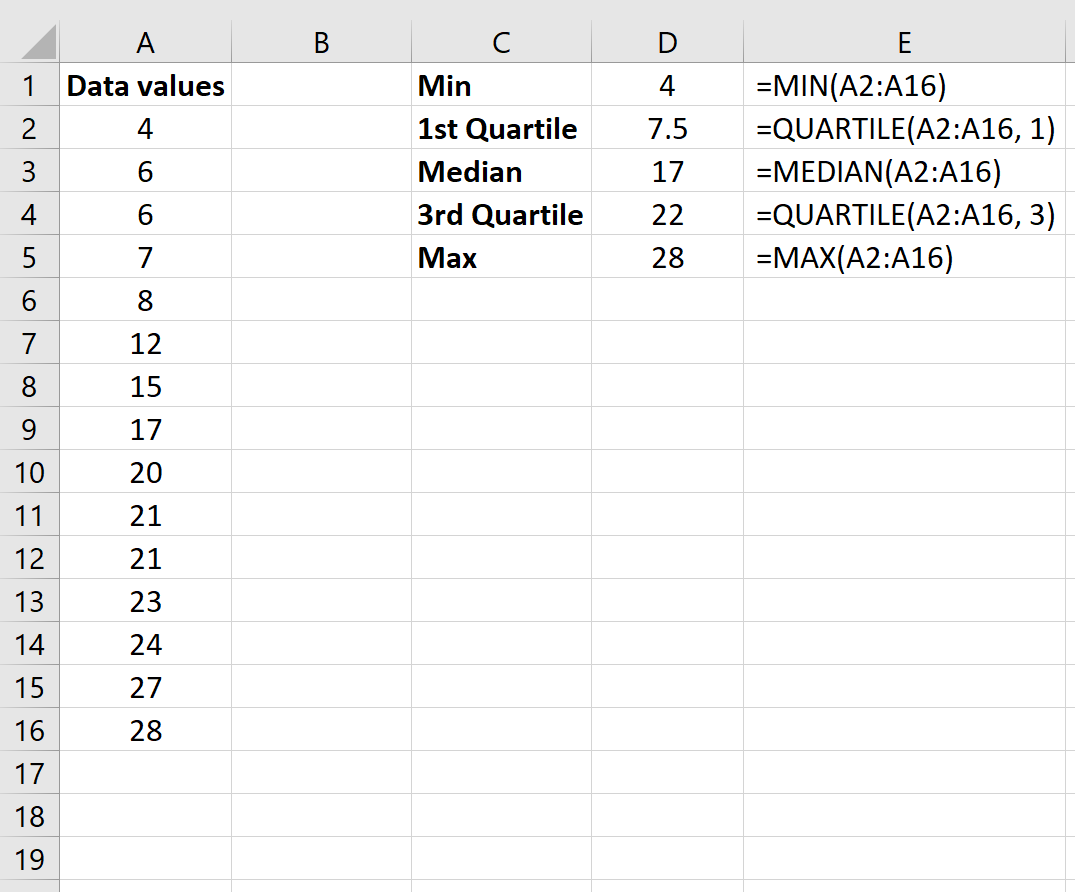
Thus, the five number summary for this data is as follows:
Minimum: 4
1st Quartile: 7.5
Median: 17
3rd Quartile: 22
Max: 28
Technical Note:
There are technically two quartile functions in Excel:
QUARTILE.INC() – Calculates percentiles using “greater than or equal to” in an “inclusive” manner.
QUARTILE.EXC() – Calculates percentiles using “greater than” in an “exclusive” manner.
The default function QUARTILE() uses the QUARTILE.INC() method.
Visualizing a Five Number Summary Using a Boxplot
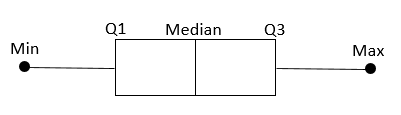
One of the easiest ways to visualize a five number summary is by creating a boxplot, sometimes called a box-and-whisker plot, which uses a box with a line in the middle along with “whiskers” that extend on each end.
You can perform the following steps to create a boxplot in Excel:
Step 1: Highlight the data values.

Step 2: In the Insert tab in the Charts group along the top ribbon, click the tiny arrow in the bottom left corner to “See All Charts.”
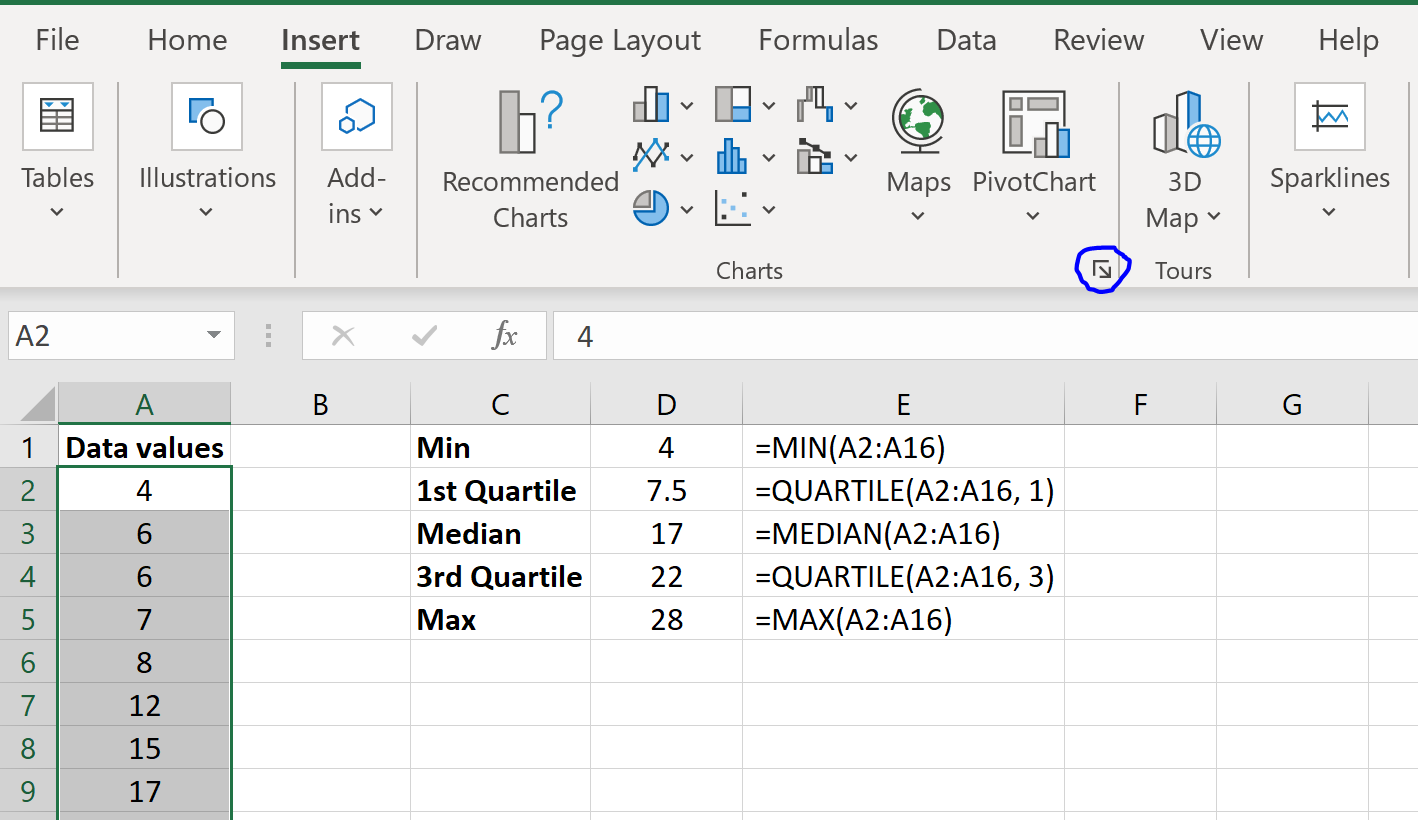
Step 3: Select “Box & Whisker” and click OK.
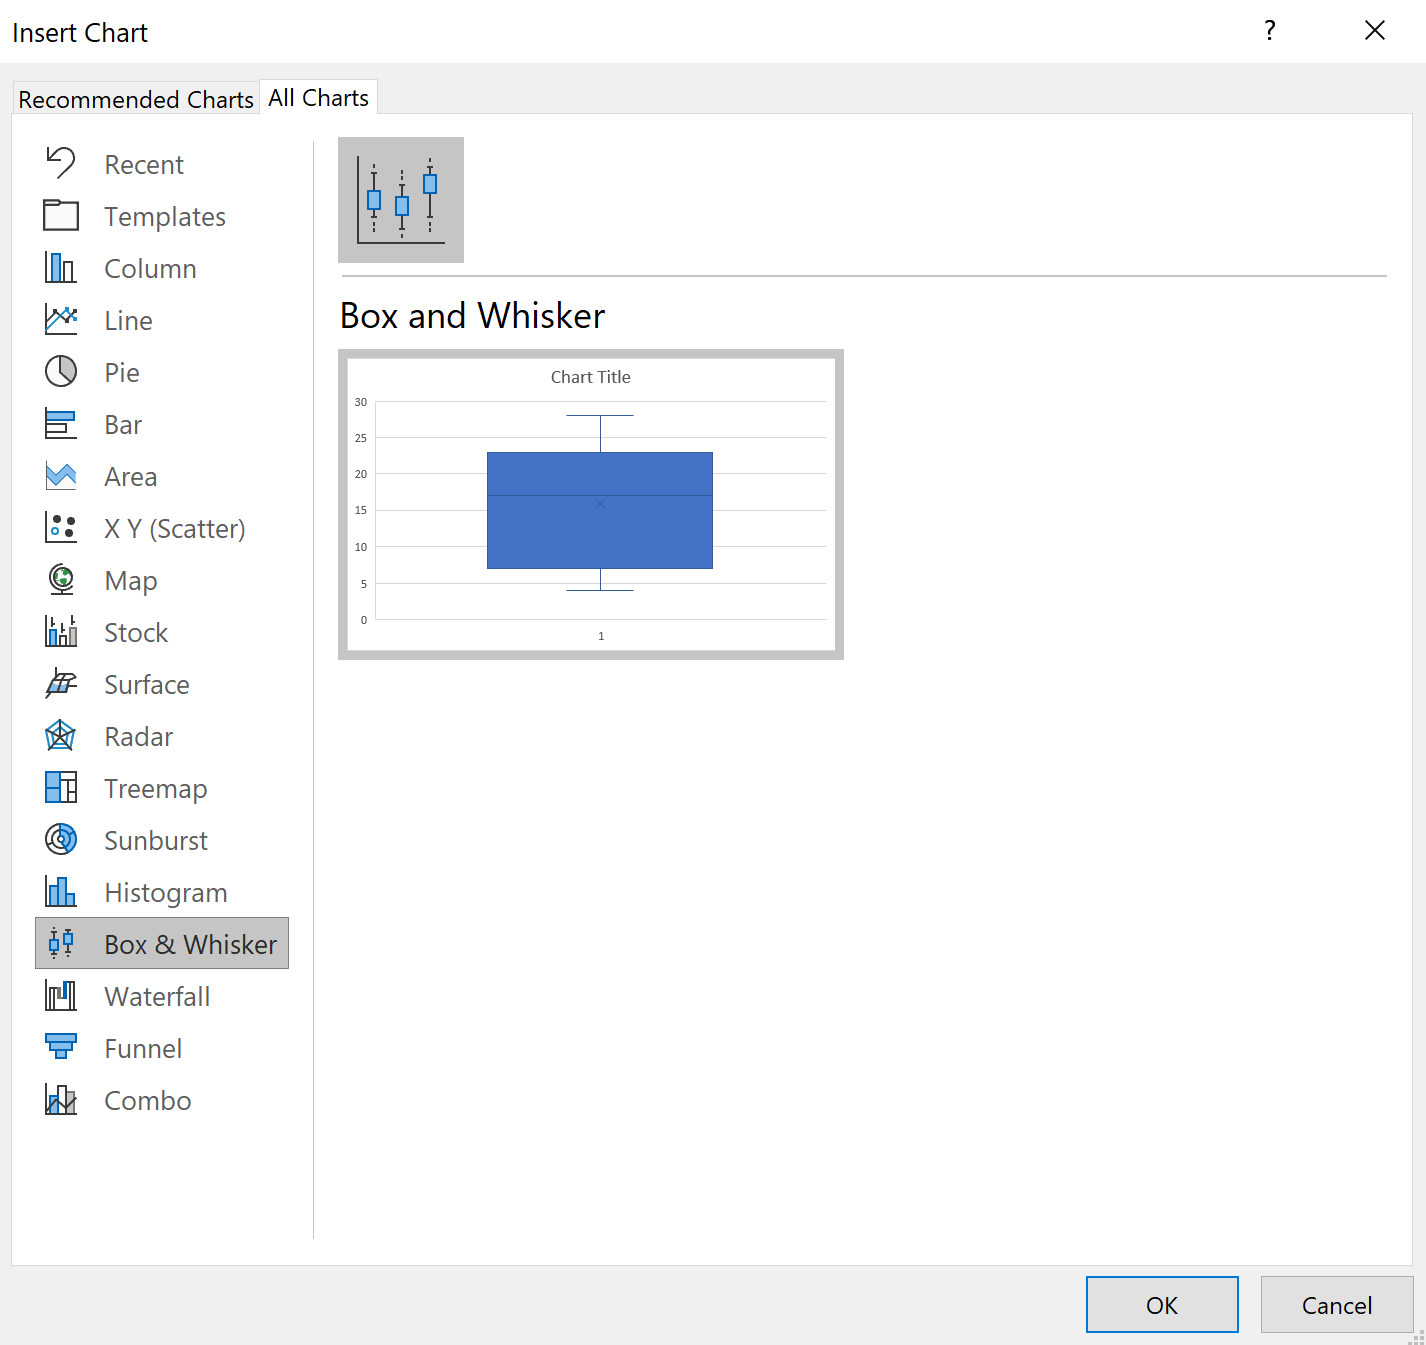
A box and whisker plot will automatically be displayed.
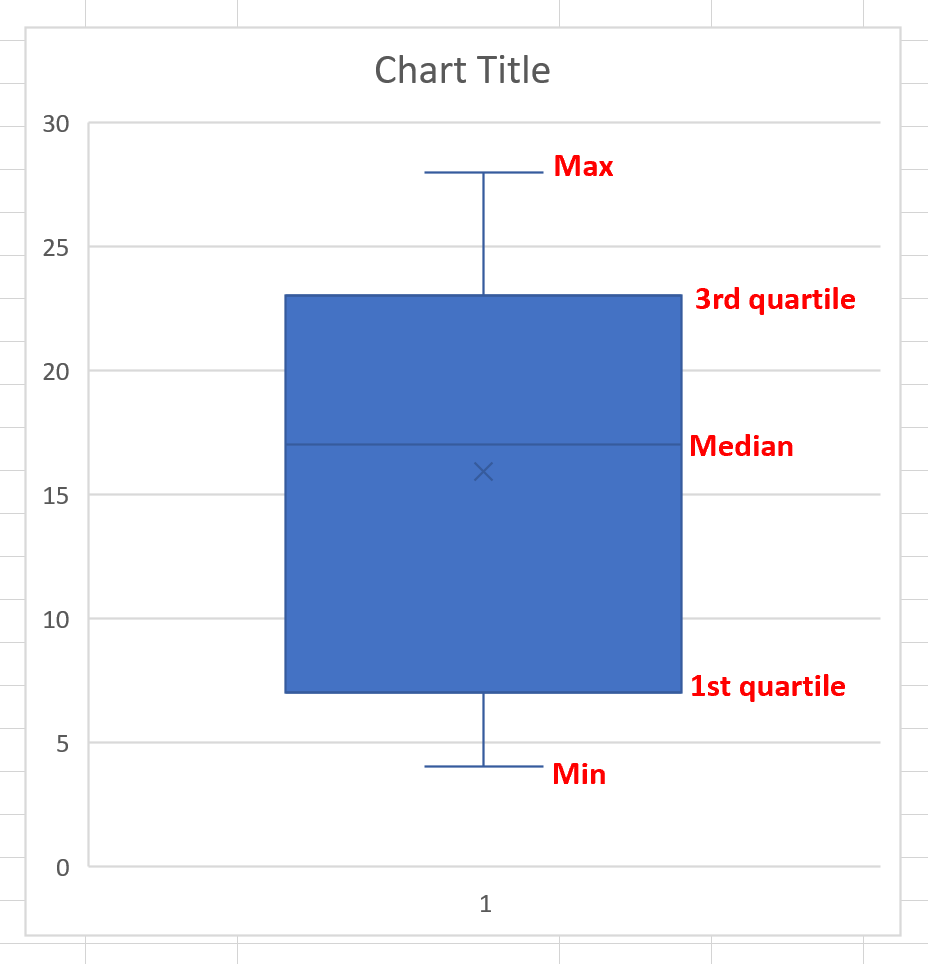
The top whisker represents the max, the top of the box represents the 3rd quartile, the middle line in the box represents the median, the tiny “x” in the box represents the average, the bottom of the box represents the 1st quartile, and the bottom whisker represents the minimum value:
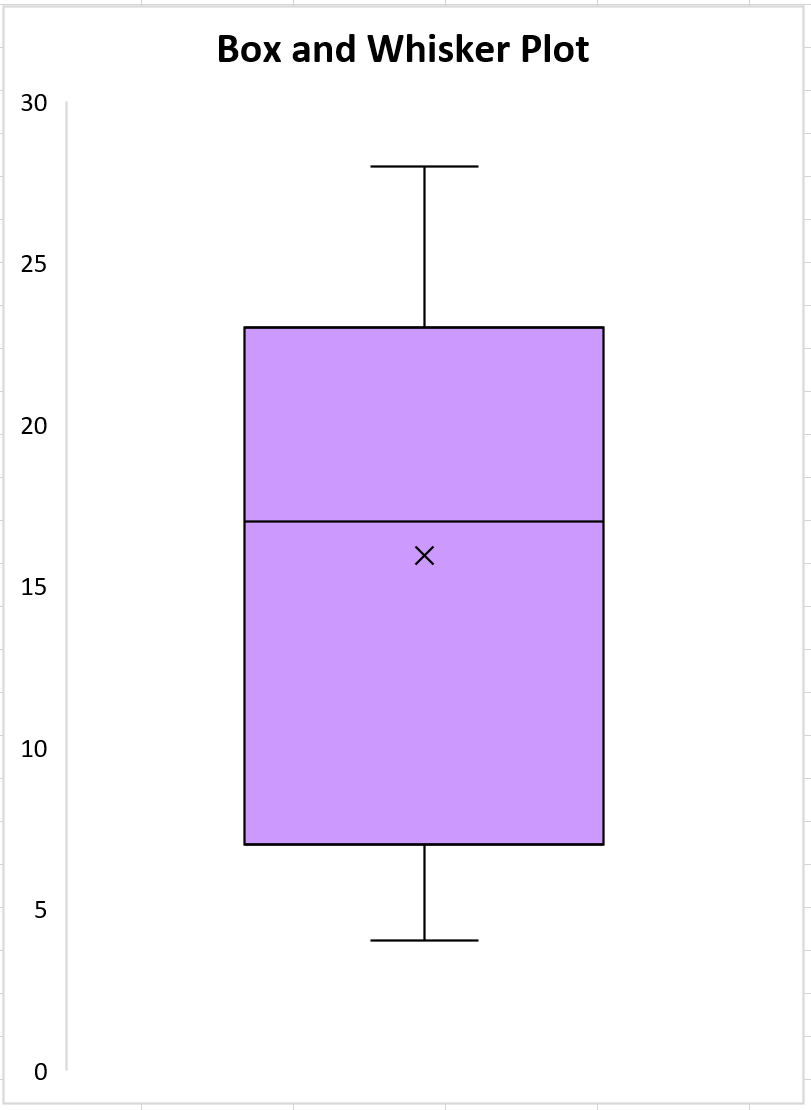
You can change the background color and the chart title as well to make it more aesthetically pleasing:
Additional Resources
How to Calculate a Five Number Summary in Google Sheets
How to Calculate a Five Number Summary in SPSS