The following step-by-step example shows how to calculate the average value by group in Excel.
Example: Calculate Average by Group in Excel
First, let’s enter the following dataset that shows the total points scored by various basketball players:

Now suppose we’d like to find the average value of the points scored, grouped by team.
To do so, we can use the UNIQUE() function to first create a list of the unique teams.
We’ll type the following formula into cell E2:
=UNIQUE(B2:B12)
Once we press Enter, a list of unique team names will be displayed:

Next, we can use the =AVERAGEIF() function to find the average of points scored by players on each team:
=AVERAGEIF($B$2:$B$12, E2, $C$2:$C$12)
We’ll type this formula into cell F2 and copy and paste it down to each remaining cell in column F:
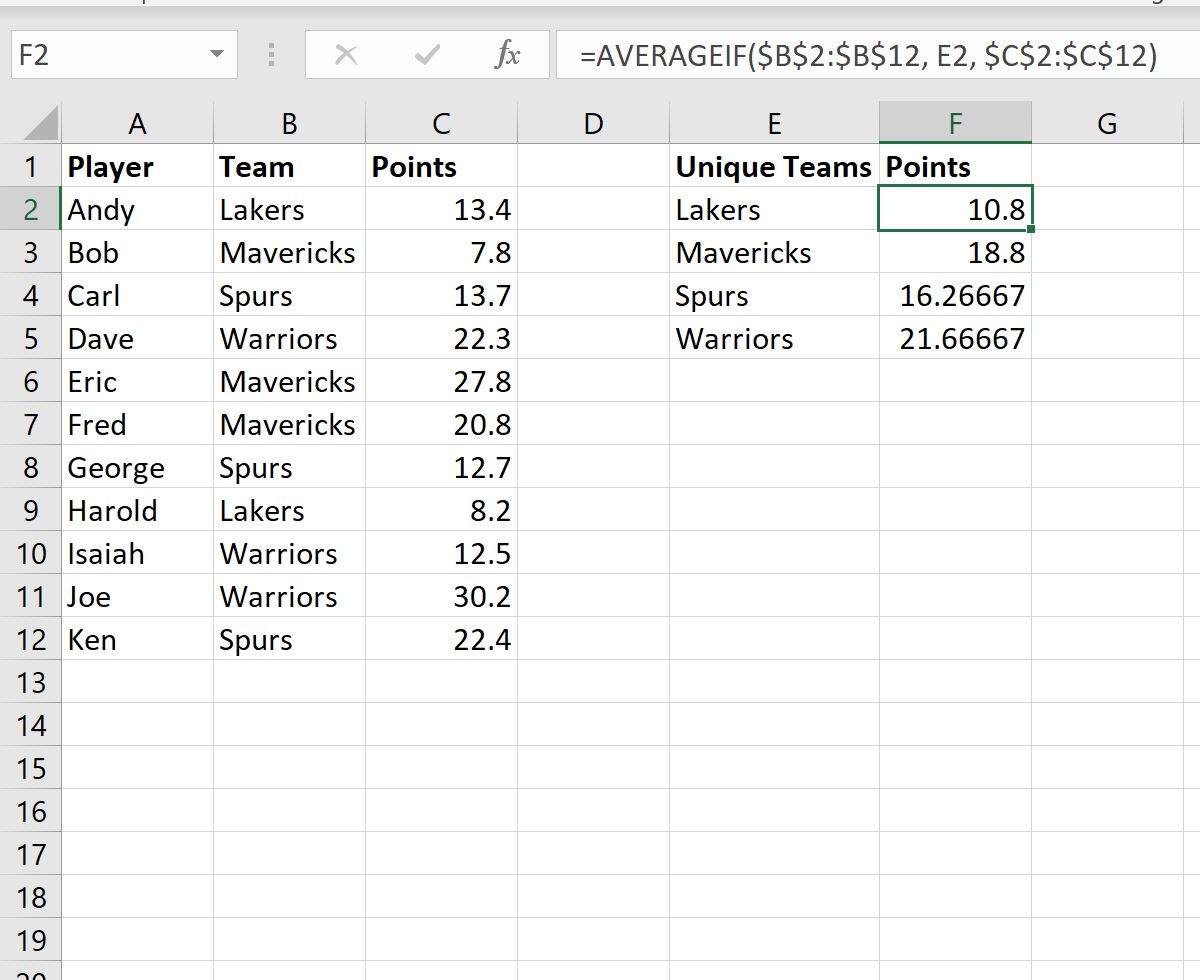
Column E displays each of the unique teams and column F displays the average value of the points scored by each team.
We can verify these results are correct by manually calculating the average for one of the teams.
For example, the average points scored by players on the Spurs team would be:
Average points by Spurs players: (13.7 + 12.7 + 22.4) / 3 = 12.26667.
This matches the value calculated using the formula.
Note: You can find the complete documentation for the AVERAGEIF formula in Excel here.
Additional Resources
The following tutorials explain how to perform other common tasks in Excel:
How to Calculate a Five Number Summary in Excel
How to Calculate the Mean and Standard Deviation in Excel
How to Calculate the Interquartile Range (IQR) in Excel