Covariance is a measure of how changes in one variable are associated with changes in a second variable. Specifically, it’s a measure of the degree to which two variables are linearly associated.
The formula to calculate the covariance between two variables, X and Y is:
COV(X, Y) = Σ(x-x)(y-y) / n
A covariance matrix is a square matrix that shows the covariance between many different variables. This can be an easy, useful way to understand how different variables are related in a dataset.
The following example shows how to create a covariance matrix in Excel using a simple dataset.
How to Create a Covariance Matrix in Excel
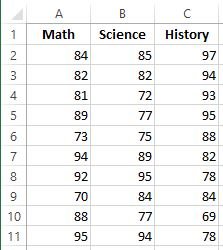
Suppose we have the following dataset that shows the test scores of 10 different students for three subjects: math, science, and history.
To create a covariance matrix for this dataset, click on the Data Analysis option in the top right of Excel under the Data tab.
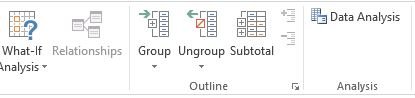
Note: If you don’t see the Data Analysis option, you need to first load the Data Analysis Toolpak.
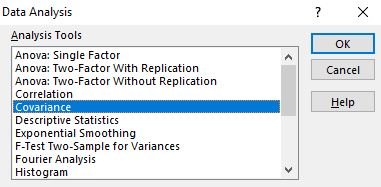
Once you click this option, a new window will appear. Click on Covariance.
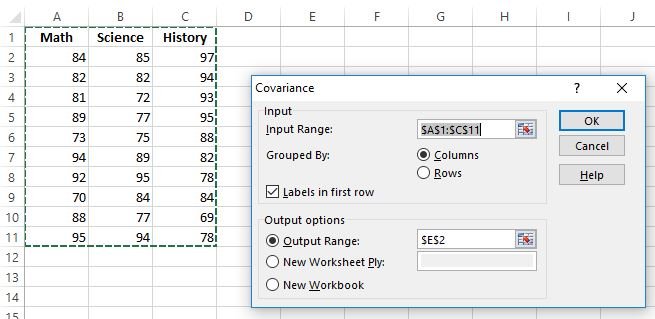
In the Input Range box, type “$A$1:$C$11”, since this is the range of cells where our dataset is located. Check the box that says Labels in first row to tell Excel that the labels for our variables are located in the first row. Then, in the Output Range box, type any cell where you would like the covariance matrix to appear. I chose cell $E$2. Then click OK.
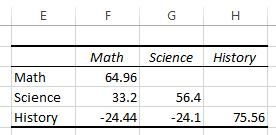
The covariance matrix is automatically generated and appears in cell $E$2:
How to Interpret a Covariance Matrix
Once we have a covariance matrix, it’s rather simple to interpret the values in the matrix.
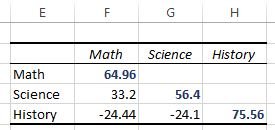
The values along the diagonals of the matrix are simply the variances of each subject. For example:
- The variance of the math scores is 64.96
- The variance of the science scores is 56.4
- The variance of the history scores is 75.56
The other values in the matrix represent the covariances between the various subjects. For example:
- The covariance between the math and science scores is 33.2
- The covariance between the math and history scores is -24.44
- The covariance between the science and history scores is -24.1
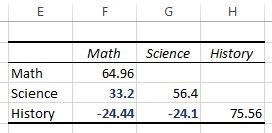
A positive number for covariance indicates that two variables tend to increase or decrease in tandem. For example, math and science have a positive covariance (33.2), which indicates that students who score high on math also tend to score high on science. Likewise, students who score low on math also tend to score low on science.
A negative number for covariance indicates that as one variable increases, a second variable tends to decrease. For example, math and history have a negative covariance (-24.44), which indicates that students who score high on math tend to score low on history. Likewise, students who score low on math tend to score high on history.