In statistics, correlation is a measure of the linear relationship between two variables.
The value for a correlation coefficient is always between -1 and 1 where:
- -1 indicates a perfectly negative linear correlation between two variables
- 0 indicates no linear correlation between two variables
- 1 indicates a perfectly positive linear correlation between two variables
The following examples illustrate real-life scenarios of negative, positive, and no correlation between variables.
Negative Correlation Examples
Example 1: Time Spent Running vs. Body Fat
The more time an individual spends running, the lower their body fat tends to be. In other words, the variable running time and the variable body fat have a negative correlation. As time spent running increases, body fat decreases.
If we created a scatterplot of time spent running vs. body fat, it may look something like this:

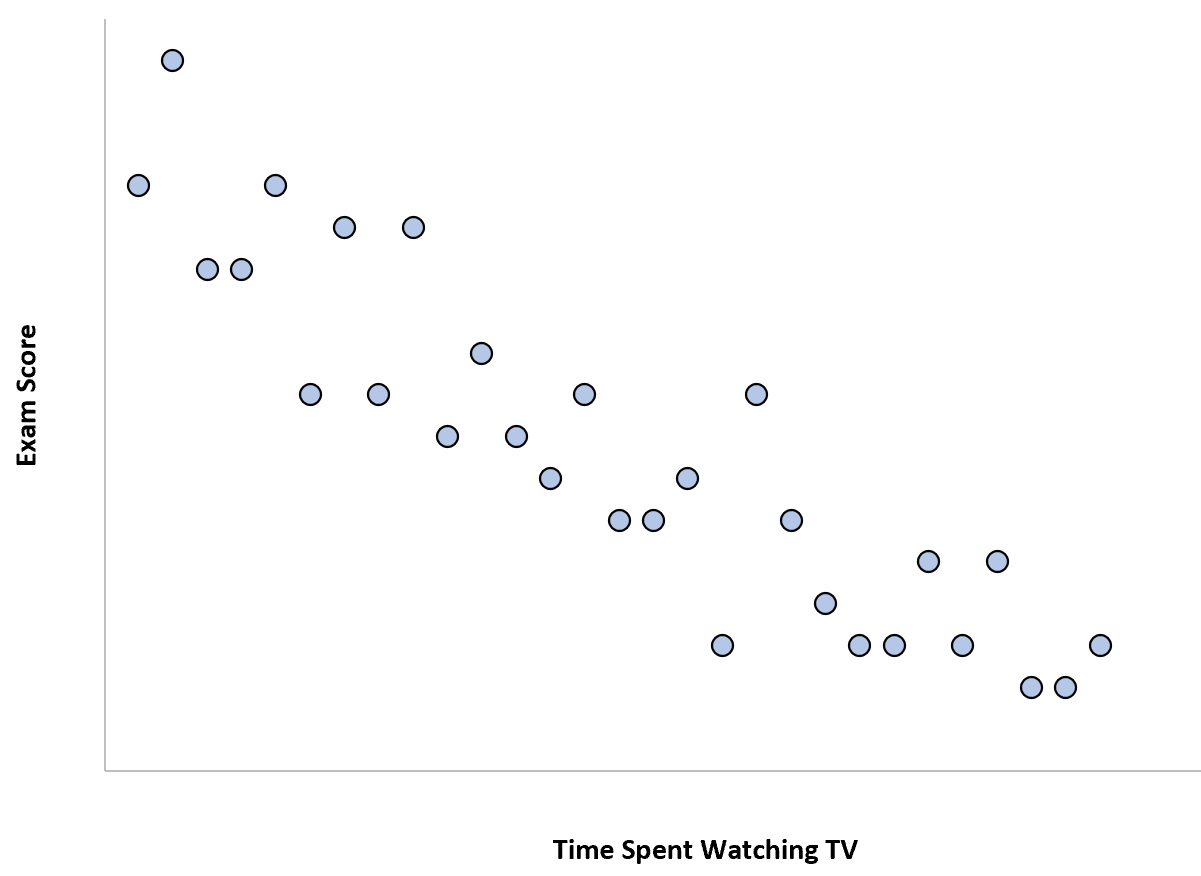
Example 2: Time Spent Watching TV vs. Exam Scores
The more time a student spends watching TV, the lower their exam scores tend to be. In other words, the variable time spent watching TV and the variable exam score have a negative correlation. As time spent watching TV increases, exam scores decrease.
If we created a scatterplot of time spent watching TV vs. exam scores, it may look something like this:
Positive Correlation Examples
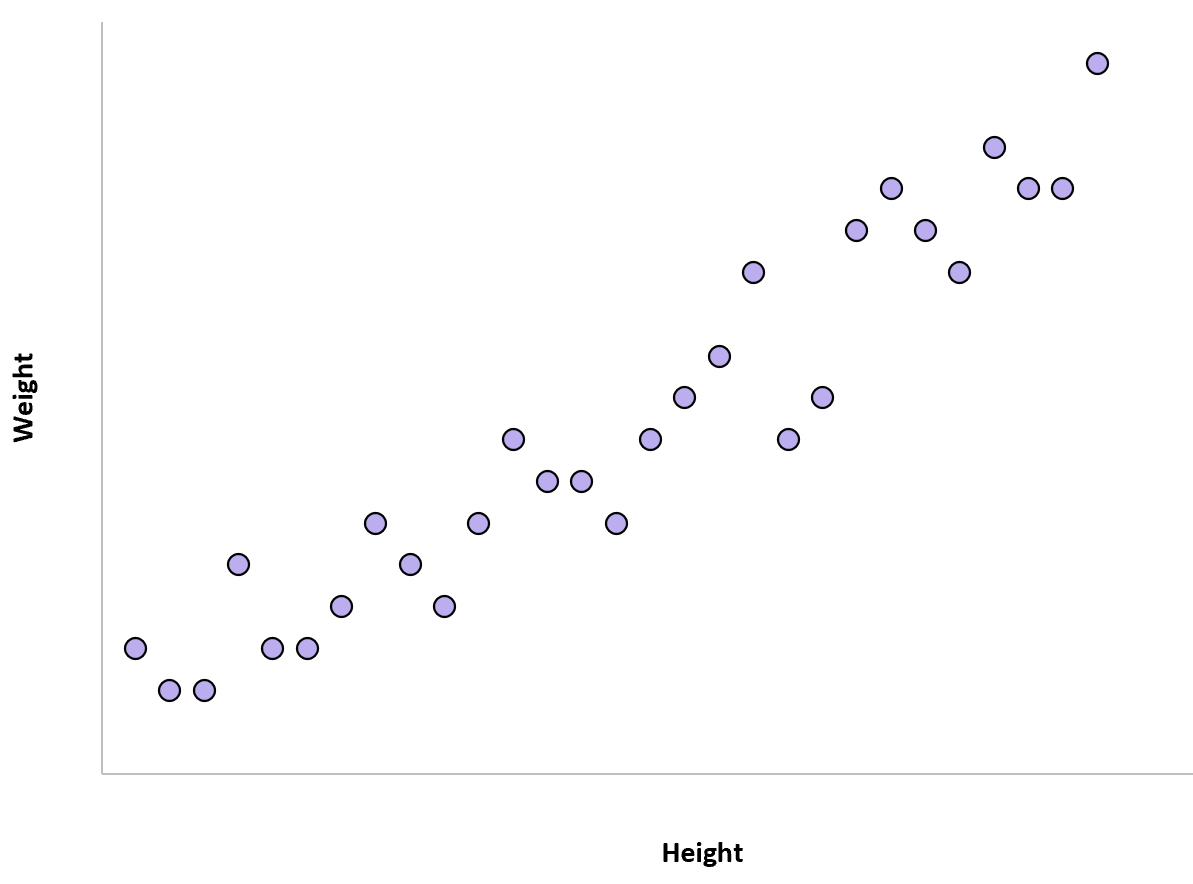
Example 1: Height vs. Weight
The correlation between the height of an individual and their weight tends to be positive. In other words, individuals who are taller also tend to weigh more.
If we created a scatterplot of height vs. weight, it may look something like this:
Example 2: Temperature vs. Ice Cream Sales
The correlation between the temperature and total ice cream sales is positive. In other words, when it’s hotter outside the total ice cream sales of companies tends to be higher since more people buy ice cream when it’s hot out.
If we created a scatterplot of temperature vs. ice cream sales, it may look something like this:

No Correlation Examples
Example 1: Coffee Consumption vs. Intelligence
The amount of coffee that individuals consume and their IQ level has a correlation of zero. In other words, knowing how much coffee an individual drinks doesn’t give us an idea of what their IQ level might be.
If we created a scatterplot of daily coffee consumption vs. IQ level, it may look something like this:

Example 2: Shoe Size vs. Movies Watched
The shoe size of individuals and the number of movies they watch per year has a correlation of zero. In other words, knowing the shoe size of an individual doesn’t give us an idea of how many movies they watch per year.
If we created a scatterplot of shoe size vs. number of movies watched, it may look like this:

Additional Resources
What is Considered to Be a “Weak” Correlation?
What is Considered to Be a “Strong” Correlation?
Correlation vs. Association: What’s the Difference?