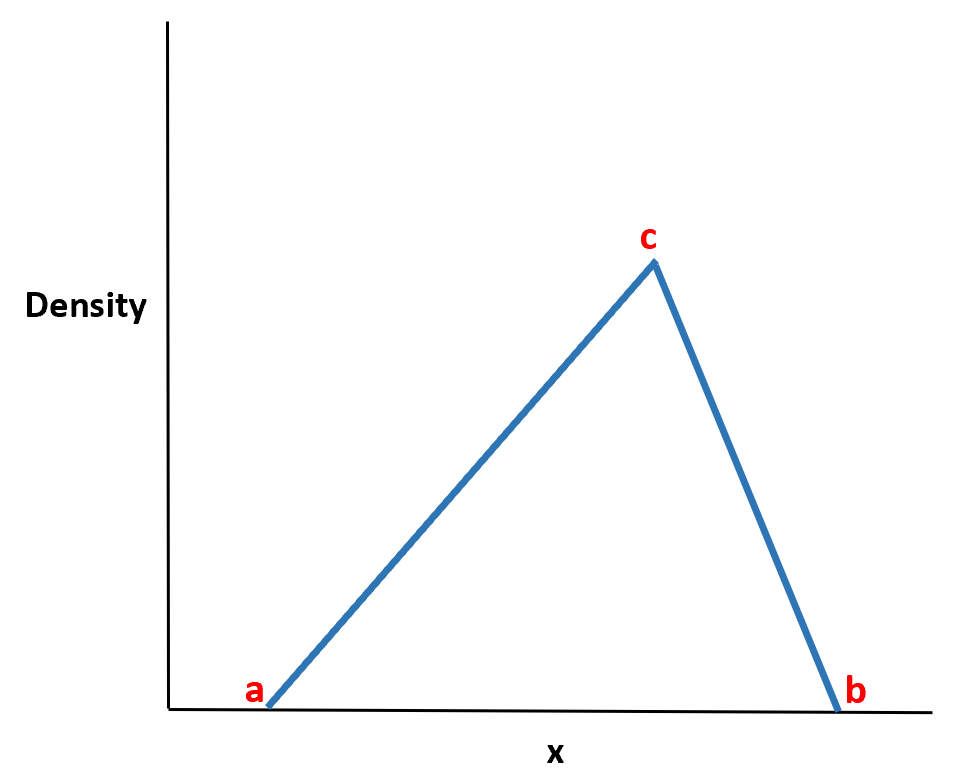
The triangular distribution is a continuous probability distribution with a probability density function shaped like a triangle.
It is defined by three values:
- The minimum value a
- The maximum value b
- The peak value c
To calculate probabilities for the triangular distribution in R we can use the ptri() function from the EnvStats package, which uses the following syntax:
ptri(q, min = 0, max = 1, mode = 1/2)
where:
- q: Quantile of interest
- min: The minimum value of the distribution
- max: The maximum value of the distribution
- mode: The peak value of the distribution
The following examples show how to use this function in practice in R.
Example 1: Calculating Probability Less Than Some Value
Suppose a restaurant estimates that their total sales for the upcoming week will be a minimum of $10,000, a maximum of $30,000, and most likely $25,000.
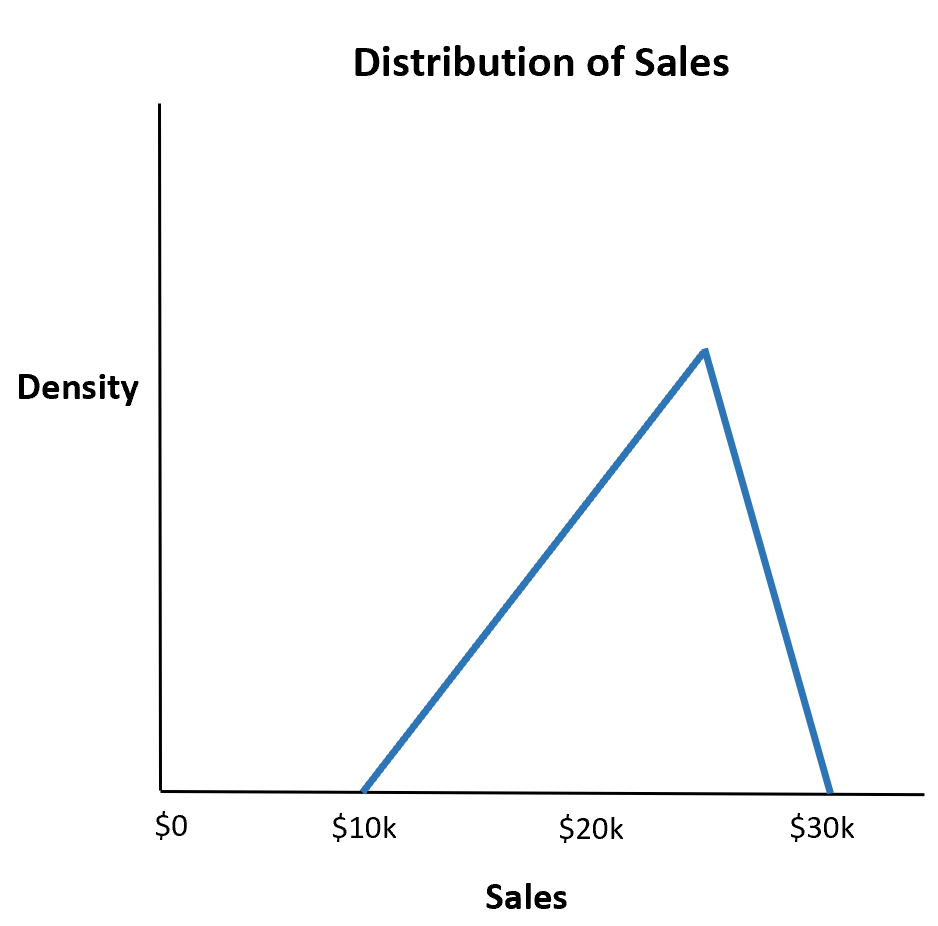
What is the probability that the restaurant makes less than $20,000 total sales?
We can use the following code to calculate this probability:
library(EnvStats)

#calculate probability
ptri(q = 20000, min = 10000, max = 30000, mode = 25000)

[1] 0.3333333
The probability that the restaurant makes less than $20,000 total sales is .333.
Example 2: Calculating Probability Greater Than Some Value
Suppose a shop estimates that the number of customers that will enter in a given week will be a minimum of 500, a maximum of 2,000, and most likely 1,200.
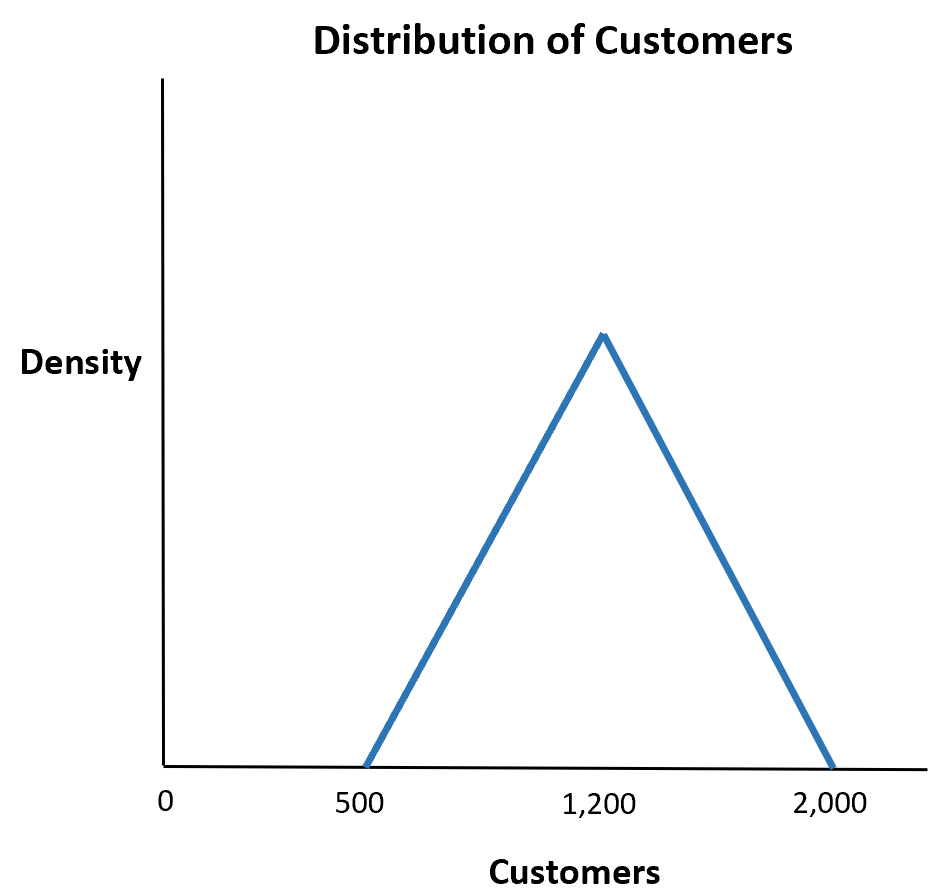
What is the probability that more than 1,500 customers enter the shop in a given week?
We can use the following code to calculate this probability:
library(EnvStats)

#calculate probability
1 - ptri(q = 1500, min = 500, max = 2000, mode = 1200)

[1] 0.2083333
The probability that more than 1,500 customers enter the shop is about .208.
Note: You can find the complete documentation for the ptri() function here.
Additional Resources
The following tutorials explain how to work with other probability distributions in R:
How to Use the Normal Distribution in R
How to Use the Binomial Distribution in R
How to Use the Poisson Distribution in R
How to Use the Multinomial Distribution in R