A residual is the difference between an observed value and a predicted value in a regression model.
It is calculated as:
Residual = Observed value – Predicted value
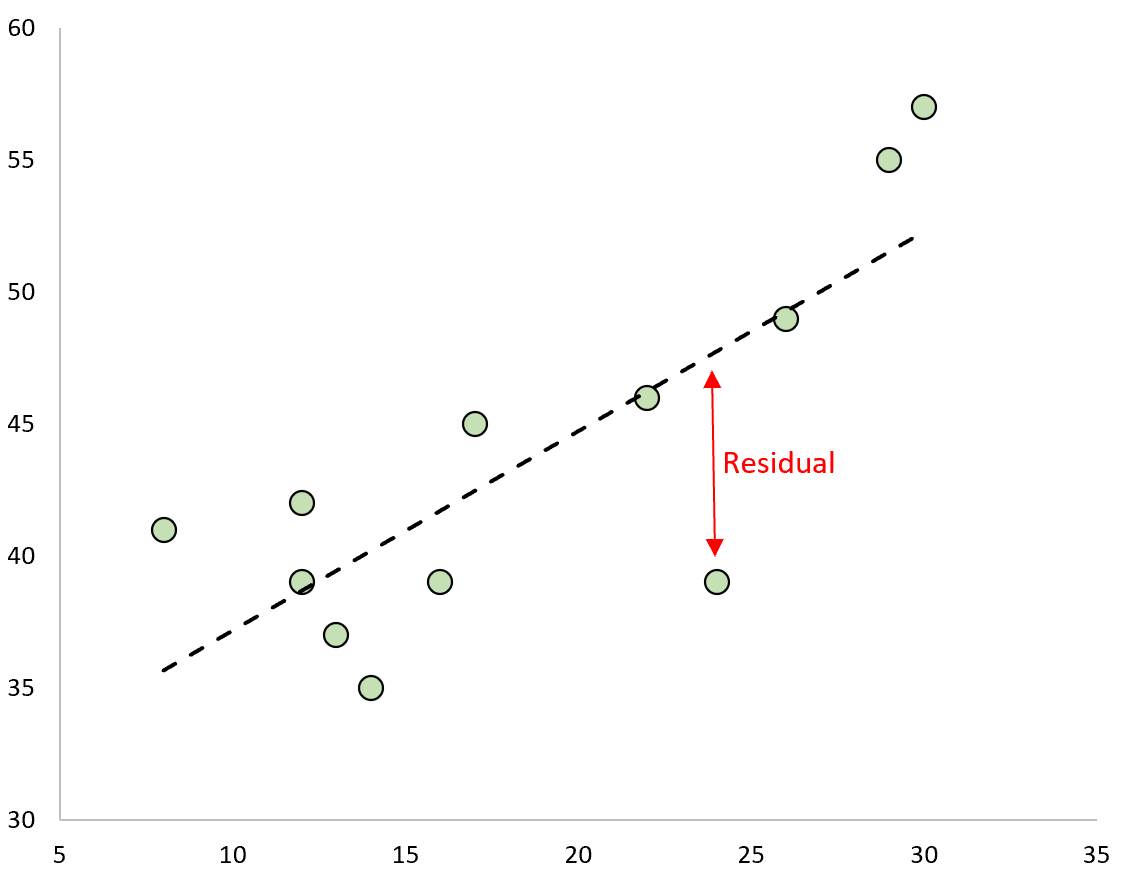
If we plot the observed values and overlay the fitted regression line, the residuals for each observation would be the vertical distance between the observation and the regression line:
One type of residual we often use to identify outliers in a regression model is known as a standardized residual.
It is calculated as:
ri = ei / s(ei) = ei / RSE√1-hii
where:
- ei: The ith residual
- RSE: The residual standard error of the model
- hii: The leverage of the ith observation
In practice, we often consider any standardized residual with an absolute value greater than 3 to be an outlier.
This tutorial provides a step-by-step example of how to calculate standardized residuals in Python.
Step 1: Enter the Data
First, we’ll create a small dataset to work with in Python:
import pandas as pd

#create dataset
df = pd.DataFrame({'x': [8, 12, 12, 13, 14, 16, 17, 22, 24, 26, 29, 30],
                   'y': [41, 42, 39, 37, 35, 39, 45, 46, 39, 49, 55, 57]})
Step 2: Fit the Regression Model
Next, we’ll fit a simple linear regression model:
import statsmodels.api as sm

#define response variable
y = df['y']

#define explanatory variable
x = df['x']

#add constant to predictor variables
x = sm.add_constant(x)

#fit linear regression model
model = sm.OLS(y, x).fit()
Step 3: Calculate the Standardized Residuals
Next, we’ll calculate the standardized residuals of the model:
#create instance of influence
influence = model.get_influence()

#obtain standardized residuals
standardized_residuals = influence.resid_studentized_internal

#display standardized residuals
print(standardized_residuals)

[ 1.40517322  0.81017562  0.07491009 -0.59323342 -1.2482053  -0.64248883
  0.59610905 -0.05876884 -2.11711982 -0.066556    0.91057211  1.26973888]
From the results we can see that none of the standardized residuals exceed an absolute value of 3. Thus, none of the observations appear to be outliers.
Step 4: Visualize the Standardized Residuals
Lastly, we can create a scatterplot to visualize the values for the predictor variable vs. the standardized residuals:
import matplotlib.pyplot as plt

plt.scatter(df.x, standardized_residuals)
plt.xlabel('x')
plt.ylabel('Standardized Residuals')
plt.axhline(y=0, color='black', linestyle='--', linewidth=1)
plt.show()

Additional Resources
What Are Residuals?
What Are Standardized Residuals?
How to Calculate Standardized Residuals in R
How to Calculate Standardized Residuals in Excel