You can use the plt.xscale() and plt.yscale() functions to use a log scale for the x-axis and y-axis, respectively, in a seaborn plot:
import matplotlib.pyplot as plt
import seaborn as sns

#create scatterplot with log scale on both axes
sns.scatterplot(data=df, x='x', y='y')
plt.xscale('log')
plt.yscale('log')
The following example shows how to use these functions in practice.
Example: Use Log Scale in Seaborn Plot
Suppose we have the following pandas DataFrame:
import pandas as pd

#create DataFrame
df = pd.DataFrame({'x': [2, 5, 6, 7, 9, 13, 14, 16, 18],
                   'y': [200, 1700, 2300, 2500, 2800, 2900, 3400, 3900, 11000]})

#view DataFrame
print(df)

    x      y
0   2    200
1   5   1700
2   6   2300
3   7   2500
4   9   2800
5  13   2900
6  14   3400
7  16   3900
8  18  11000
We can use the scatterplot() function in seaborn to create a scatterplot that uses a linear scale on both the x-axis and y-axis:
import seaborn as sns

#create scatterplot with default axis scales
sns.scatterplot(data=df, x='x', y='y')

To use a log scale for the y-axis only, we can use the following syntax:
import matplotlib.pyplot as plt
import seaborn as sns

#create scatterplot with log scale on y-axis
sns.scatterplot(data=df, x='x', y='y')
plt.yscale('log')
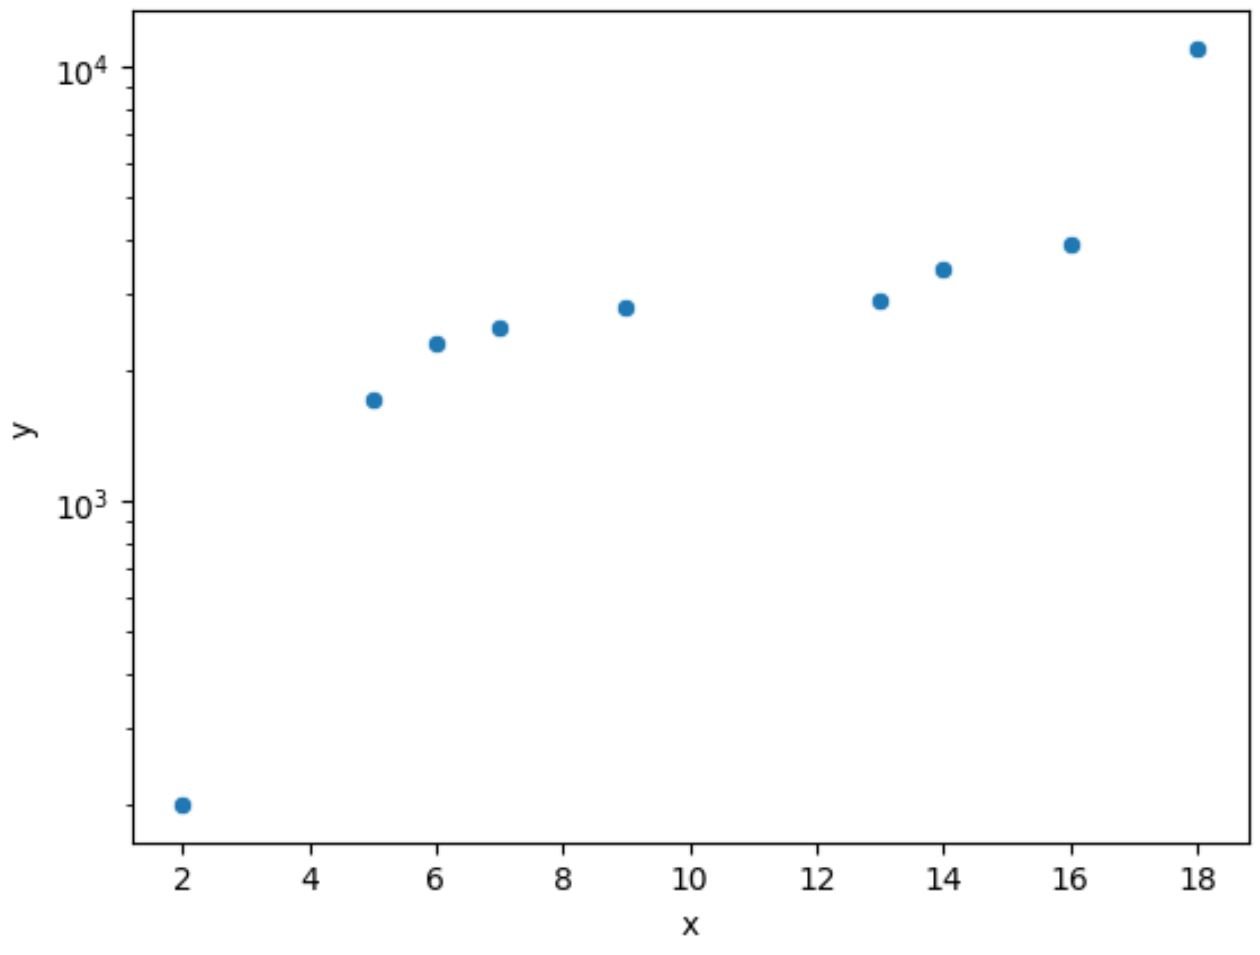
Notice that the y-axis now uses a log scale.
We can also use a log scale on the x-axis if we’d like:
import matplotlib.pyplot as plt
import seaborn as sns

#create scatterplot with log scale on both axes
sns.scatterplot(data=df, x='x', y='y')
plt.yscale('log')
plt.xscale('log')
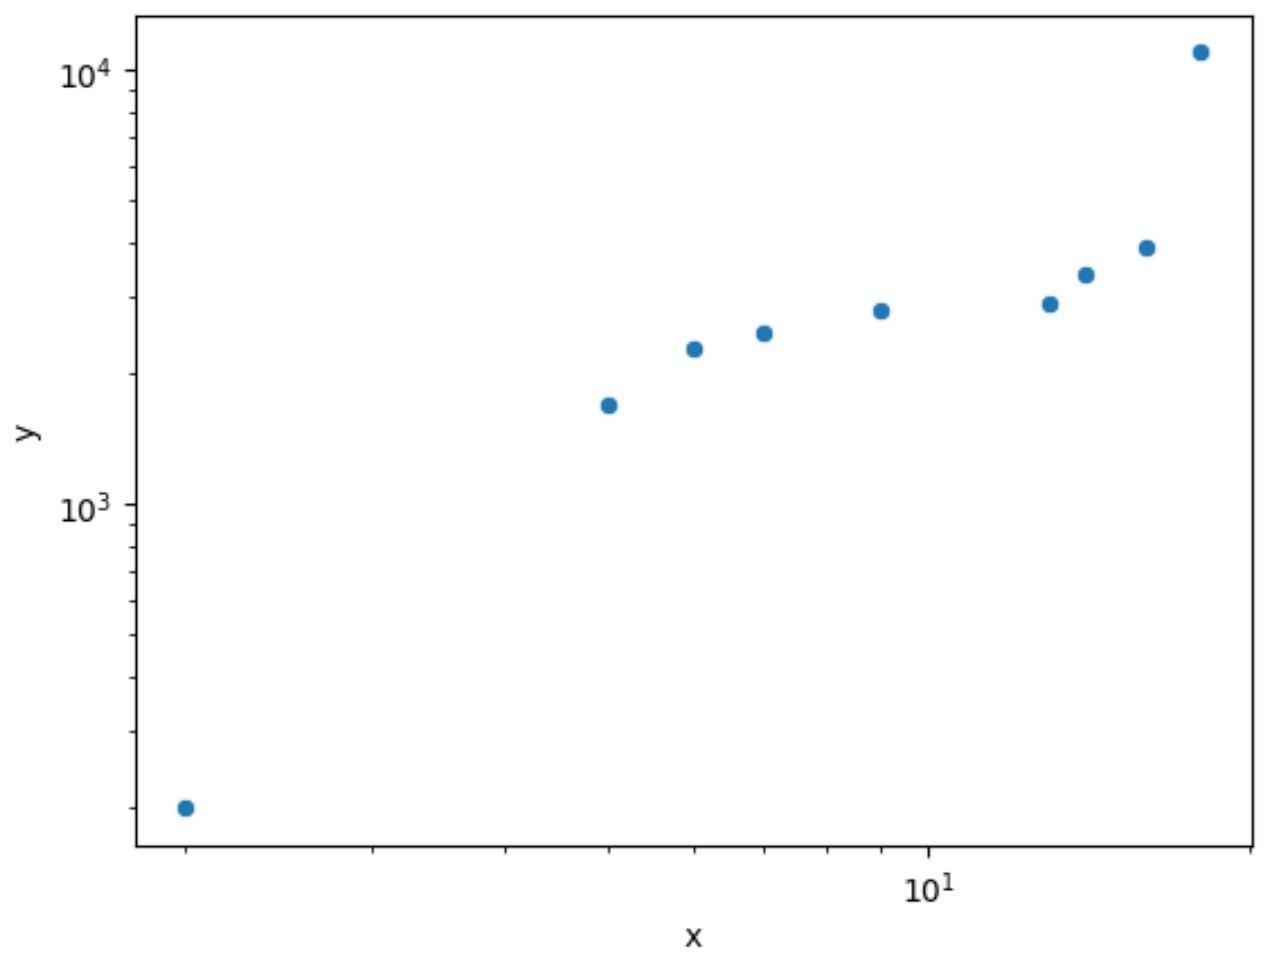
Notice that both axes now use a log scale.
Related: When Should You Use a Log Scale in Charts?
Additional Resources
The following tutorials explain how to perform other common tasks in seaborn:
How to Add a Title to Seaborn Plots
How to Rotate Axis Labels in Seaborn Plots
How to Change Axis Labels on a Seaborn Plot