Residual plots are often used to assess whether or not the residuals in a regression model are normally distributed and whether or not they exhibit heteroscedasticity.
You can use the following basic syntax to fit a regression model and produce a residual plot for the model in SAS:
symbol value = circle;

proc reg data=my_data;
    model y = x;
    plot residual. * predicted.;
run;
The following example shows how to use this syntax in practice.
Note: The symbol statement specifies that we would like to display the points in the residual plot as circles. The default shape is a plus sign.
Example: Create Residual Plot in SAS
Suppose we have the following dataset in SAS:
/*create dataset*/
data my_data;
    input x y;
    datalines;
8 41
12 42
12 39
13 37
14 35
16 39
17 45
22 46
24 39
26 49
29 55
30 57
;
run;

/*view dataset*/
proc print data=my_data;

We can use the following syntax to fit a simple linear regression model to this dataset and create a residual plot to visualize the residuals vs. predicted values:
/*fit simple linear regression model and create residual plot*/
symbol value = circle;
proc reg data=my_data;
   model y = x;
   plot residual. * predicted.;
run;
The residual plot will be displayed at the bottom of the output:
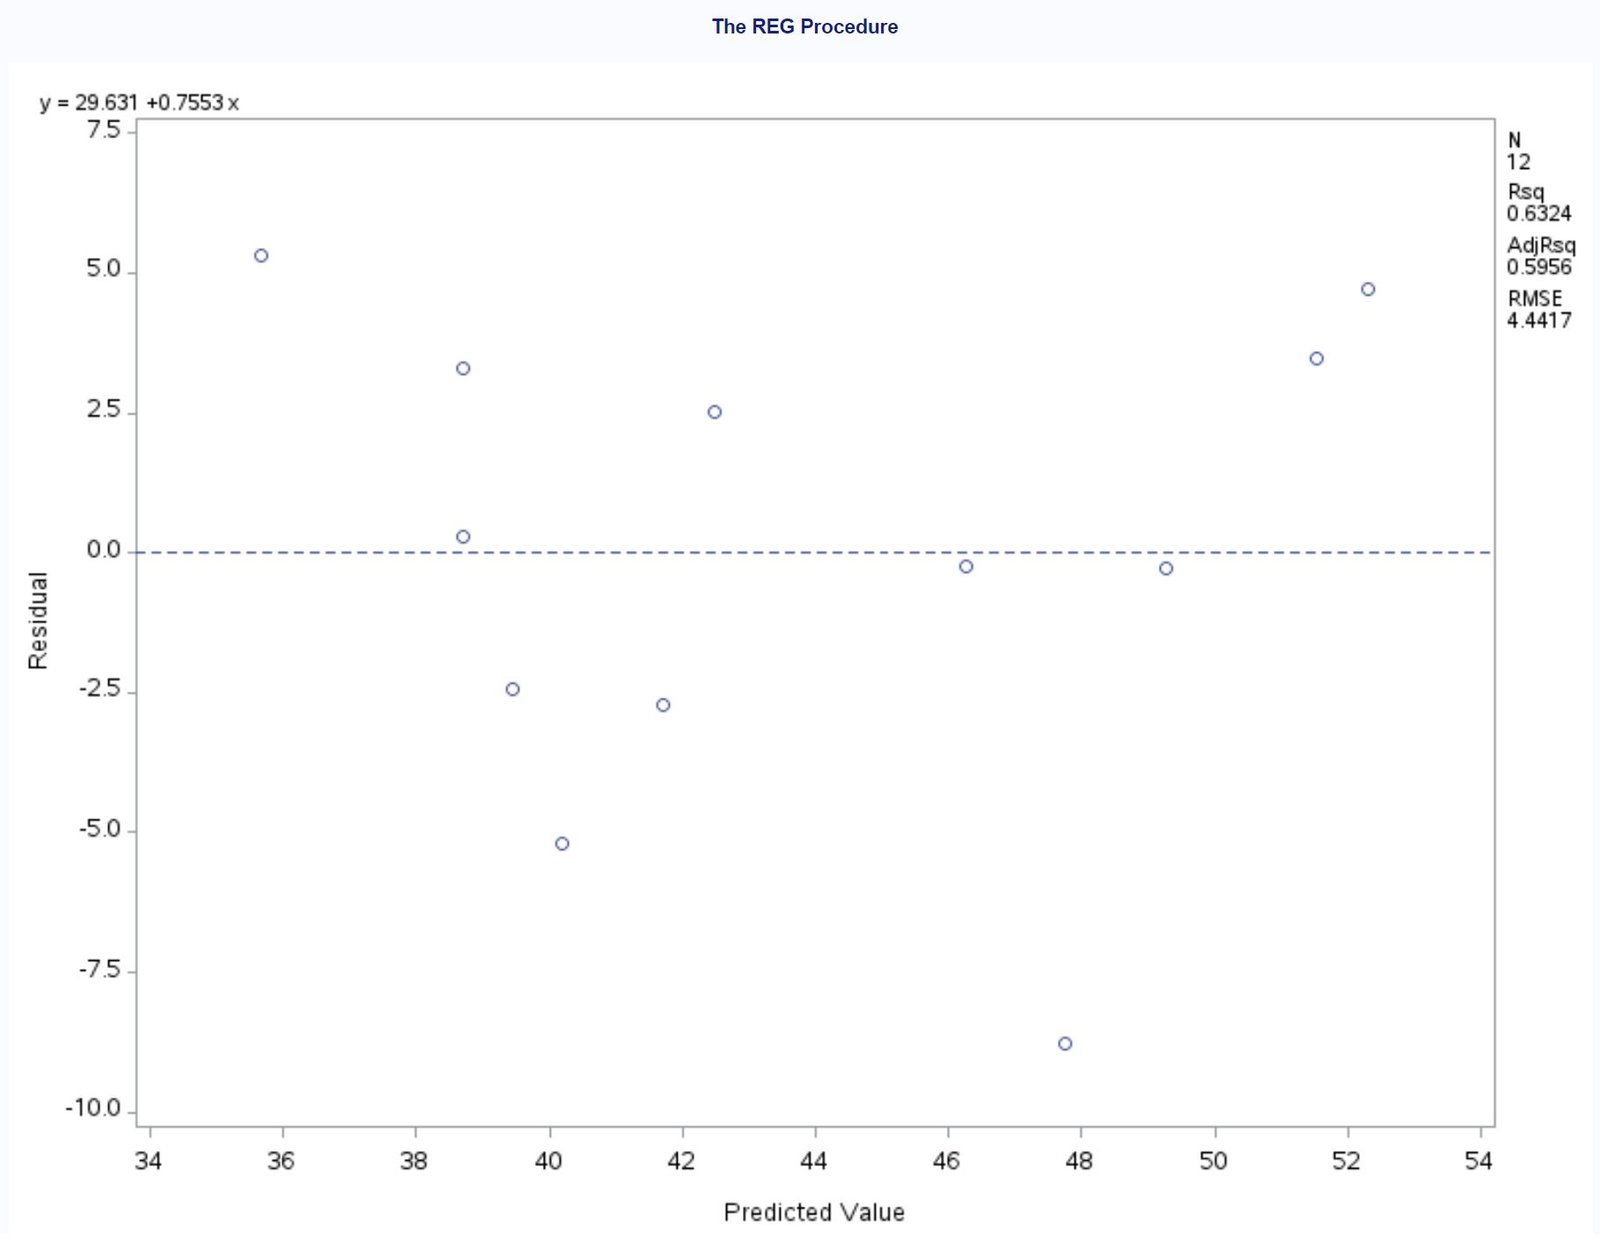
The x-axis displays the predicted values and the y-axis displays the residuals.
Since the residuals are randomly scattered about the value zero with no clear pattern of increasing or decreasing variance, the assumption of homoscedasticity of residuals is met.
Along the top of the plot we can also see the fitted regression equation:
y = 29.631 + 0.7553x
And along the right side of the plot we can also see the following metrics for the regression model:
- N: Total number of observations (12)
- Rsq: R-squared of the model (0.6324)
- AdjRsq: Adjusted R-squared of the model (0.5956)
- RMSE: The root mean squared error of the model (4.4417)
Additional Resources
The following tutorials explain how to perform other common tasks in SAS:
How to Create Histograms in SAS
How to Create Scatter Plots in SAS
How to Identify Outliers in SAS