One error you may encounter in R is:
Error in barplot.default(df) : 'height' must be a vector or a matrix
This error occurs when you attempt to use the barplot() function to create a bar plot in R, yet you provide the name of a data frame instead of the name of a column within the data frame.
This tutorial shares exactly how to fix this error.
How to Reproduce the Error
Suppose we have the following data frame in R:
#create data frame
df frame(player=c('A', 'B', 'C', 'D', 'E'),
                 points=c(17, 12, 8, 9, 25))

#view data frame
df

  player points
1      A     17
2      B     12
3      C      8
4      D      9
5      E     25
Now suppose we attempt to use the barplot() function to create a bar plot:
#attempt to create bar plot
barplot(df)

Error in barplot.default(df) : 'height' must be a vector or a matrix
We receive an error because we provided the name of a data frame in the barplot() function instead of the name of a data frame column.
How to Fix the Error
The easiest way to fix this error is to simply provide a name of a data frame column to the barplot() function:
#create bar plot to visualize values in points column
barplot(df$points)
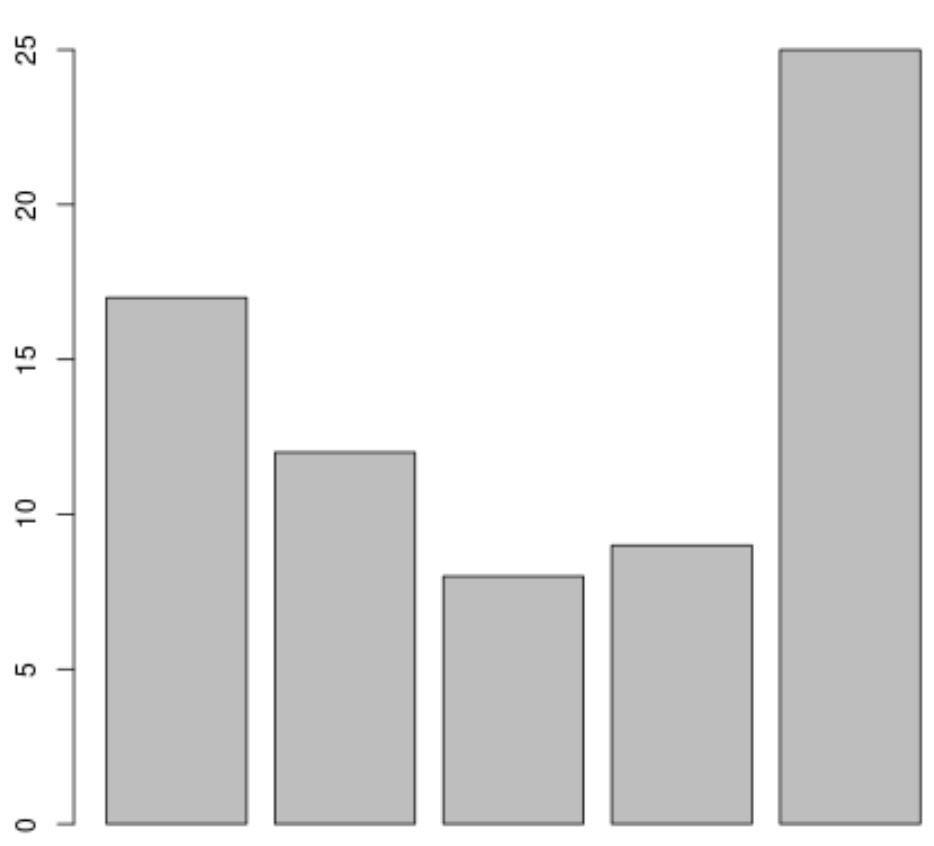
Notice that we don’t receive any error this time since we provided the name of a data frame column to the barplot() function.
Also note that we can use the following syntax to add axis labels to the plot to make it easier to interpret:
#create bar plot with labels
barplot(df$points, names=df$player, xlab='Player', ylab='Points')
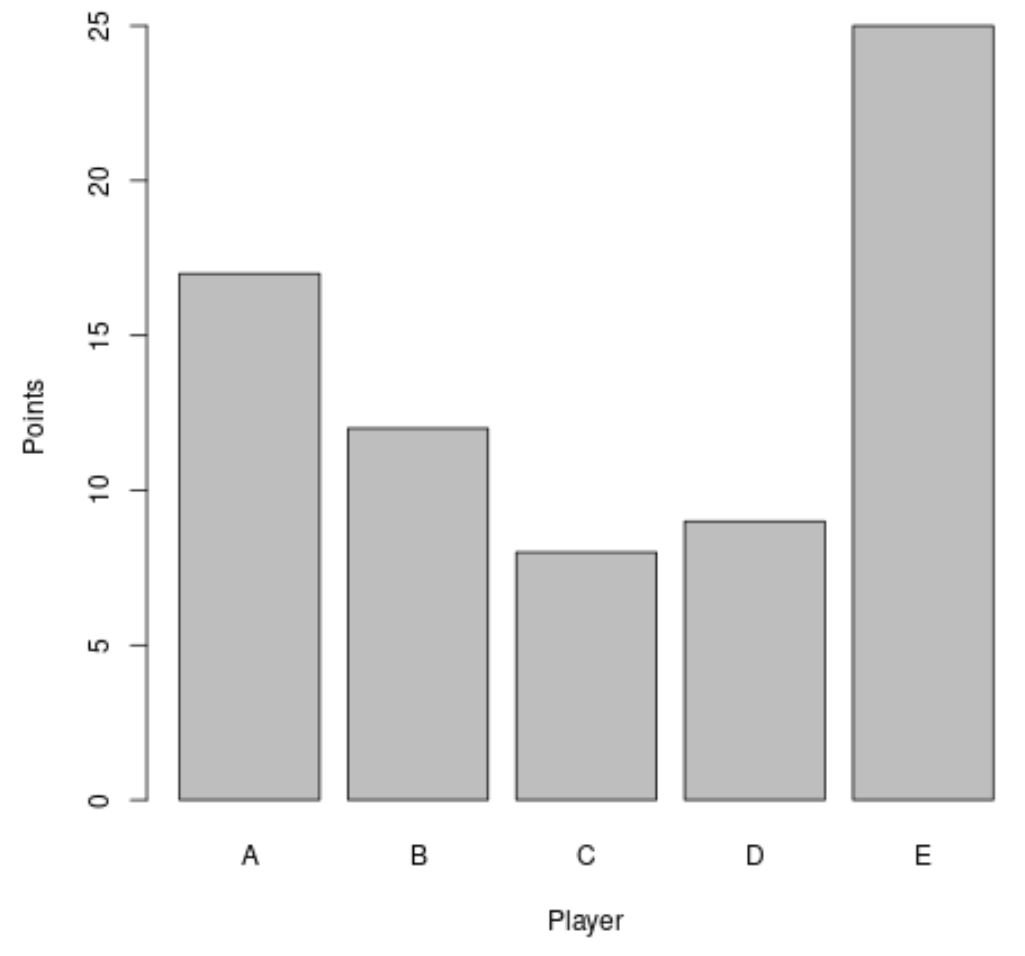
The x-axis displays the player names while the y-axis displays the points values for each player.
Additional Resources
The following tutorials explain how to fix other common errors in R:
How to Fix in R: NAs Introduced by Coercion
How to Fix in R: Subscript out of bounds
How to Fix in R: longer object length is not a multiple of shorter object length
How to Fix in R: number of items to replace is not a multiple of replacement length