You can use one of the following methods to change the x-axis labels on a boxplot in R:
Method 1: Change Axis Labels of Boxplot in Base R
boxplot(df, names=c('Label 1', 'Label 2', 'Label 3'))
Method 2: Change Axis Labels of Boxplot in ggplot2
levels(df_long$variable) Label 1', 'Label 2', 'Label 3')

ggplot(df_long, aes(variable, value)) +
  geom_boxplot()
The following examples show how to use each method in practice with the following data frame in R:
#make this example reproducible
set.seed(0)

#create data frame
df frame(A=rnorm(1000, mean=5),
                 B=rnorm(1000, mean=10),
                 C=rnorm(1000, mean=15))

#view head of data frame
head(df)

         A         B        C
1 6.262954  9.713148 15.44435
2 4.673767 11.841107 15.01193
3 6.329799  9.843236 14.99072
4 6.272429  8.610197 14.69762
5 5.414641  8.526896 15.49236
6 3.460050  9.930481 14.39728
Example 1: Change Axis Labels of Boxplot in Base R
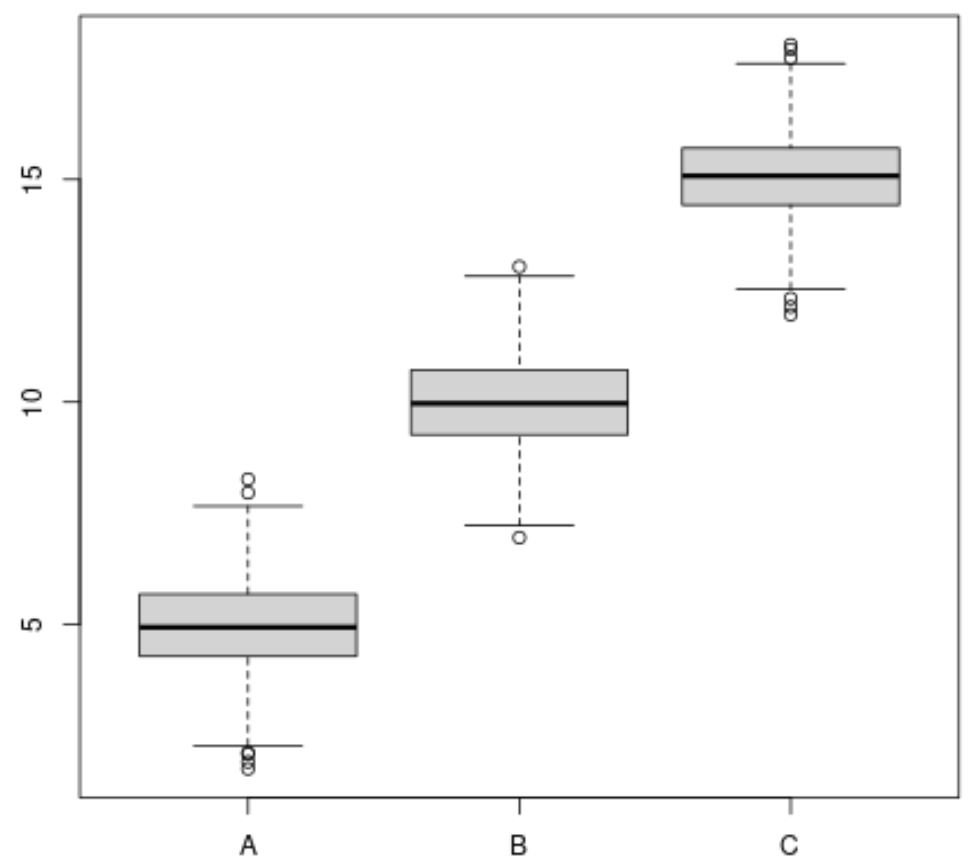
If we use the boxplot() function to create boxplots in base R, the column names of the data frame will be used as the x-axis labels by default:
#create boxplots
boxplot(df)
However, we can use the names argument to specify the x-axis labels to use:
#create boxplots with specific x-axis names
boxplot(df, names=c('Team A', 'Team B', 'Team C'))
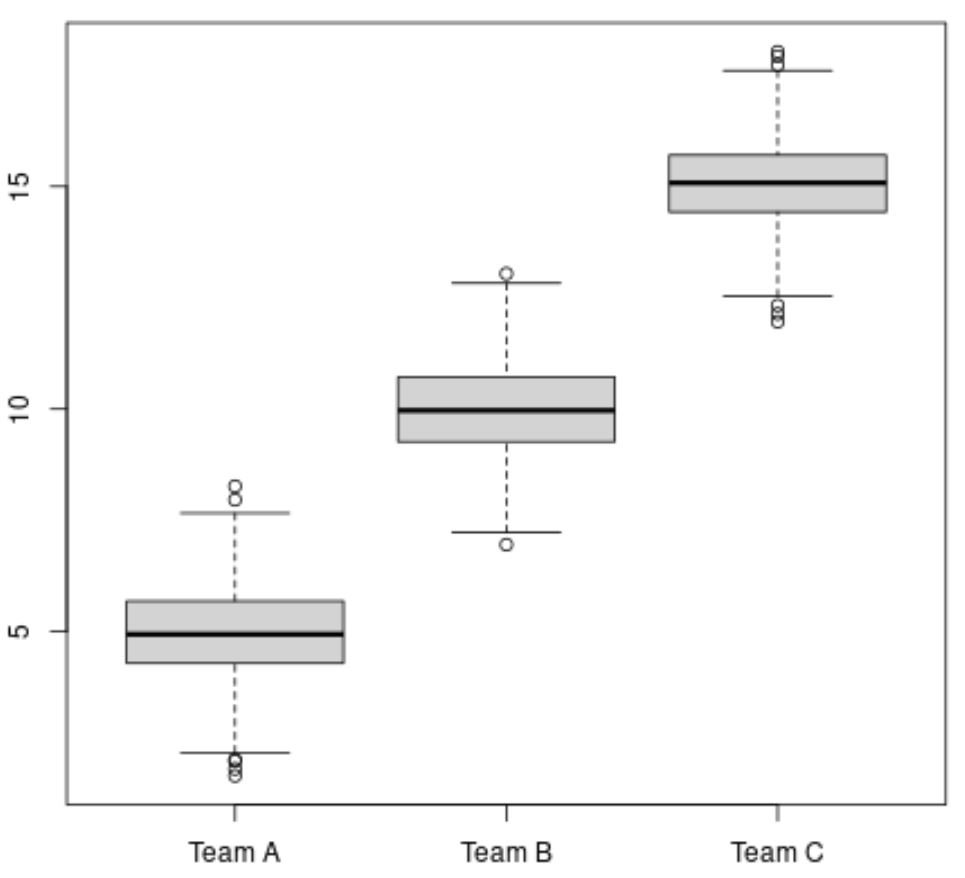
Notice that the labels we specified in the names argument are now used as the x-axis labels.
Example 2: Change Axis Labels of Boxplot in ggplot2
Before we can create boxplots in ggplot2, we must use the melt() function from the reshape2 package to “melt” the data frame into a long format:
library(reshape2)

#reshape data frame to long format
df_long #view head of long data frame
head(df_long)

  variable    value
1        A 6.262954
2        A 4.673767
3        A 6.329799
4        A 6.272429
5        A 5.414641
6        A 3.460050
We can then use the levels() function to specify the x-axis labels and the geom_boxplot() function to actually create the boxplot in ggplot2:
library(ggplot2)

#specify x-axis names to use
levels(df_long$variable) Team A', 'Team B', 'Team C')

#create box plot with specific x-axis labels
ggplot(df_long, aes(variable, value)) +
  geom_boxplot()
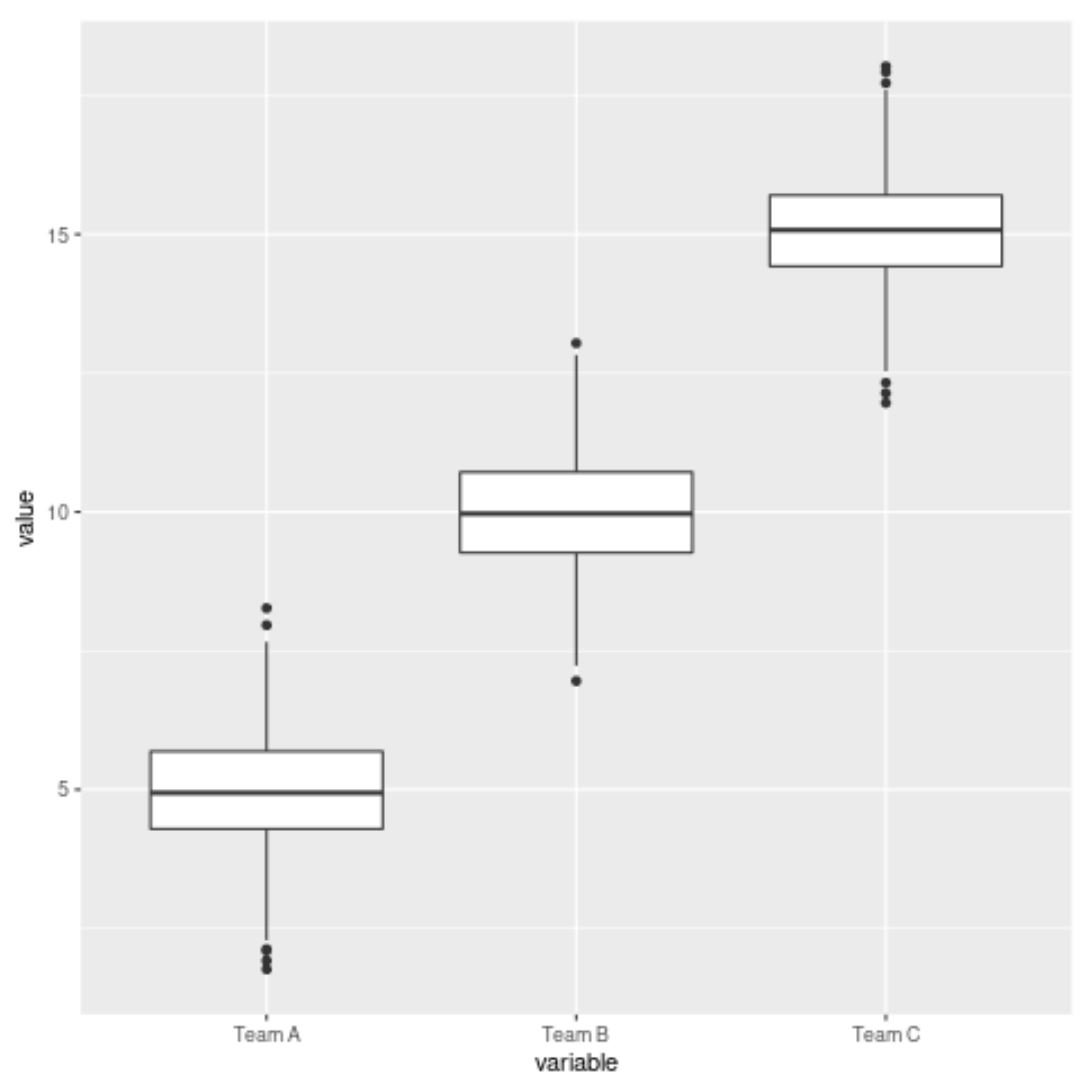
Notice that the labels we specified using the levels function are now used as the x-axis labels.
Additional Resources
The following tutorials explain how to perform other common tasks in R:
How to Reorder Boxplots in R
How to Create a Grouped Boxplot in R
How to Label Outliers in Boxplots in R
How to Draw Boxplots with Mean Values in R