You can use the following basic syntax to add text outside of a plot in R:
text(x=8, y=-0.5, 'Some Text', xpd=NA)
This particular example adds the text ‘Some Text’ to the (x, y) location of (8, -0.5).
Note that the xpd argument takes on three potential values for where to place your text:
- FALSE: Inside the plot only
- TRUE: In the outer plotting area
- NA: Anywhere on plotting device
By specifying xpd=NA, we’re able to add text outside of our plot.
The following examples show how to use this syntax in practice.
Example 1: Add One Text Element Outside of Plot
The following code shows how to add one text element outside of the plot in the bottom right corner:
#define variables
x #create scatterplot
plot(x, y)

#add text outside of plot
text(x=8, y=-0.5, 'Some Text', xpd=NA)
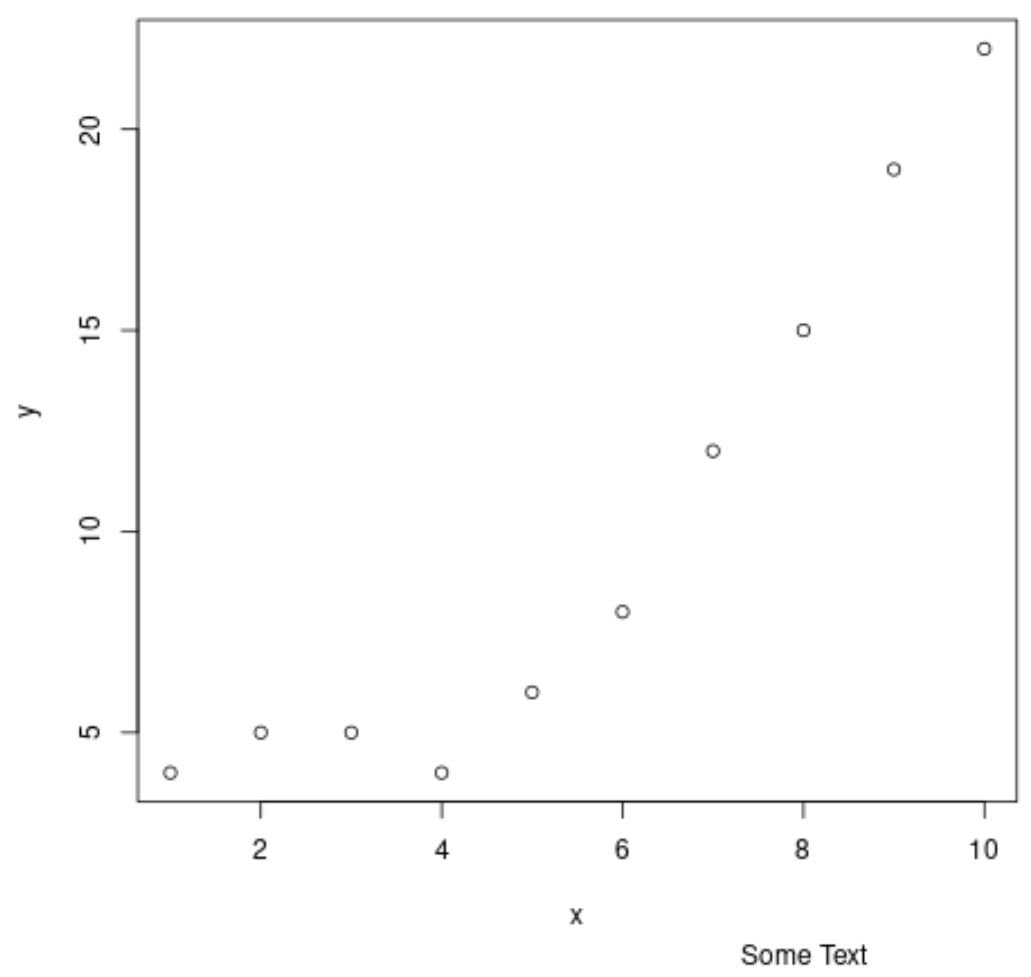
Notice that our text element has been added to the (x, y) coordinates of (8, -0.5) in the plot.
Since the value for the y-coordinate is less than the lower limit of the y-axis, the text element ends up being placed below the plot.
Example 2: Add Multiple Text Elements Outside of Plot
The following code shows how to add multiple text elements outside of the plot by using the text() function multiple times:
#define variables
x #create scatterplot
plot(x, y)

#add multiple text elements outside of plot
text(x=8, y=-0.5, 'Below Plot', xpd=NA)
text(x=8, y=25, 'Above Plot', xpd=NA)
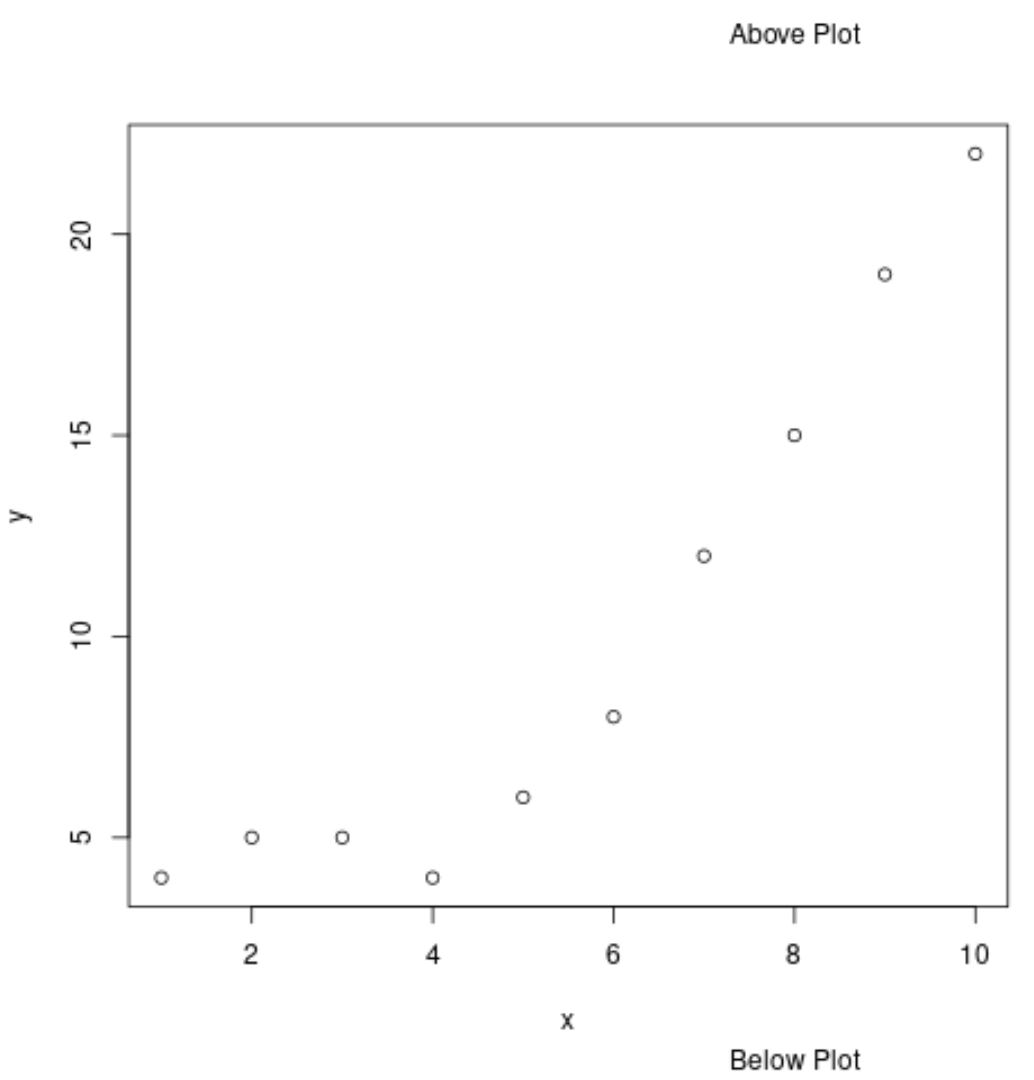
By using the text() function multiple times, we’re able to add multiple text elements outside of the plot.
Feel free to play around with the x and y arguments within the text() function to place text in the exact position you’d like.
Additional Resources
The following tutorials explain how to use other common functions in R:
How to Draw a Legend Outside of a Plot in R
How to Change Legend Position in Base R Plots
How to Print String and Variable on Same Line in R