In statistics, quintiles are numbers that split a dataset into five groups of equal frequency.
- The first quintile is the point where 20% of all data values lie below it.
- The second quintile is the point where 40% of all data values lie below it.
- The third quintile is the point where 60% of all data values lie below it.
- The fourth quintile is the point where 80% of all data values lie below it.
We can use the following basic formula to calculate the quintiles for a dataset in Google Sheets:
=PERCENTILE(CELL RANGE, QUINTILE)
For example, we can use the following formula to calculate the first quantile in the range A1:A10:
=PERCENTILE(A1:A10, 0.2)
The following example shows how to use this function in practice.
Example: Calculate Quintiles in Google Sheets
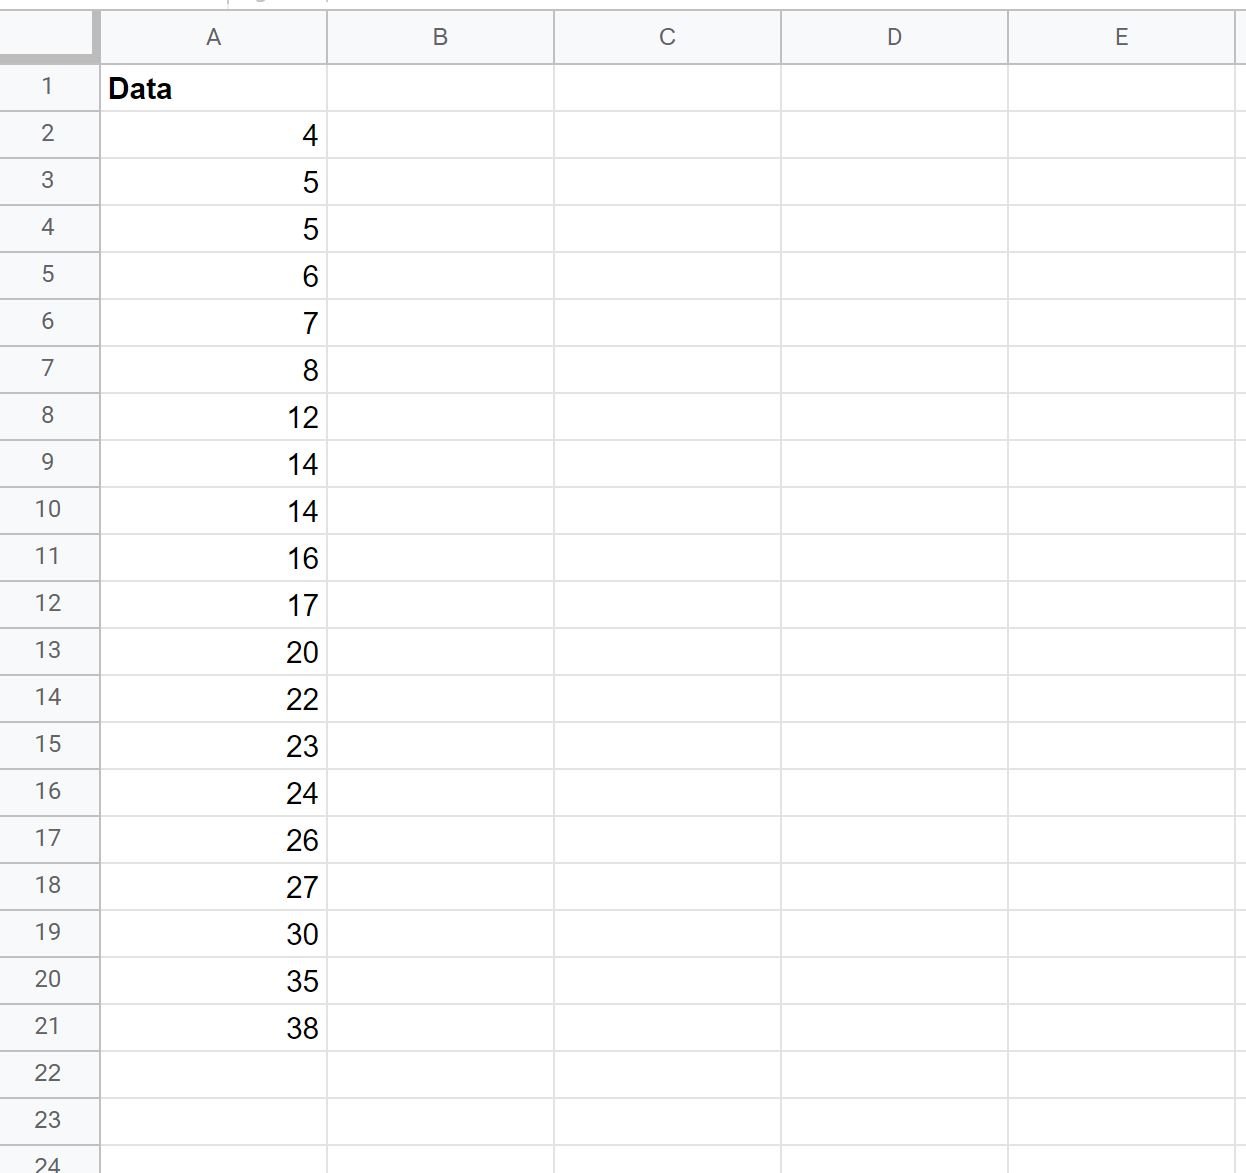
Suppose we have the following dataset in Google Sheets with 20 values:
The following screenshot shows how to calculate the quintiles for the dataset:
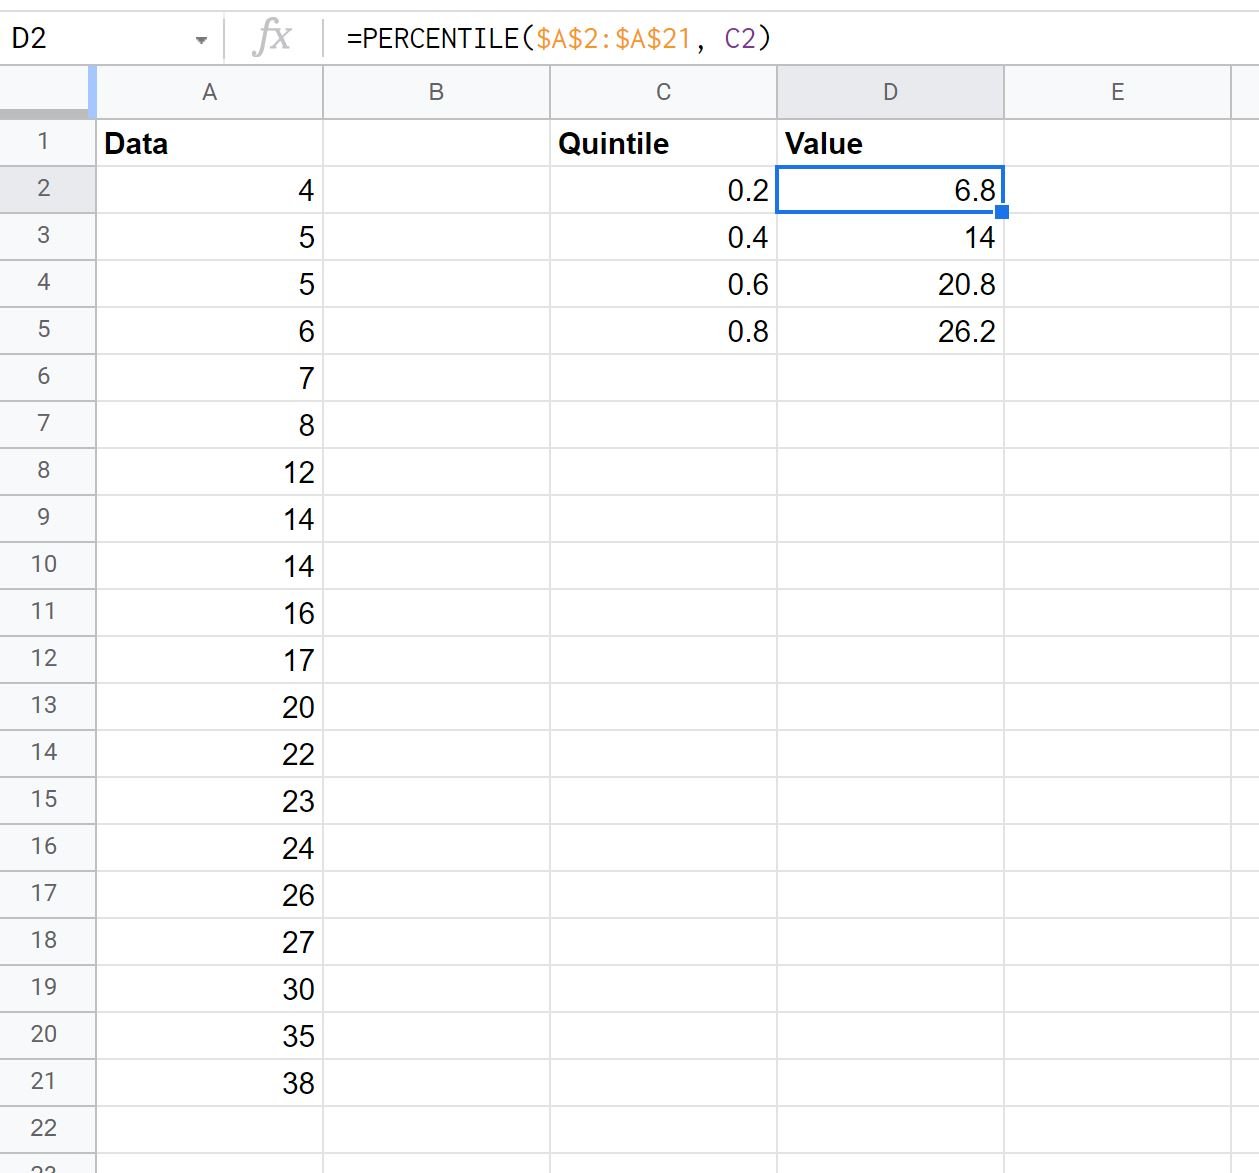
Here is how to interpret the quintile values:
- 20% of all data values lie below 6.8.
- 40% of all data values lie below 14.
- 60% of all data values lie below 20.8.
- 80% of all data values lie below 26.2.
We can also use the following formula to calculate each quintile at the same time:
=ArrayFormula(PERCENTILE($A$2:$A$21, {0.2, 0.4, 0.6, 0.8}))
The following image shows how to do so:
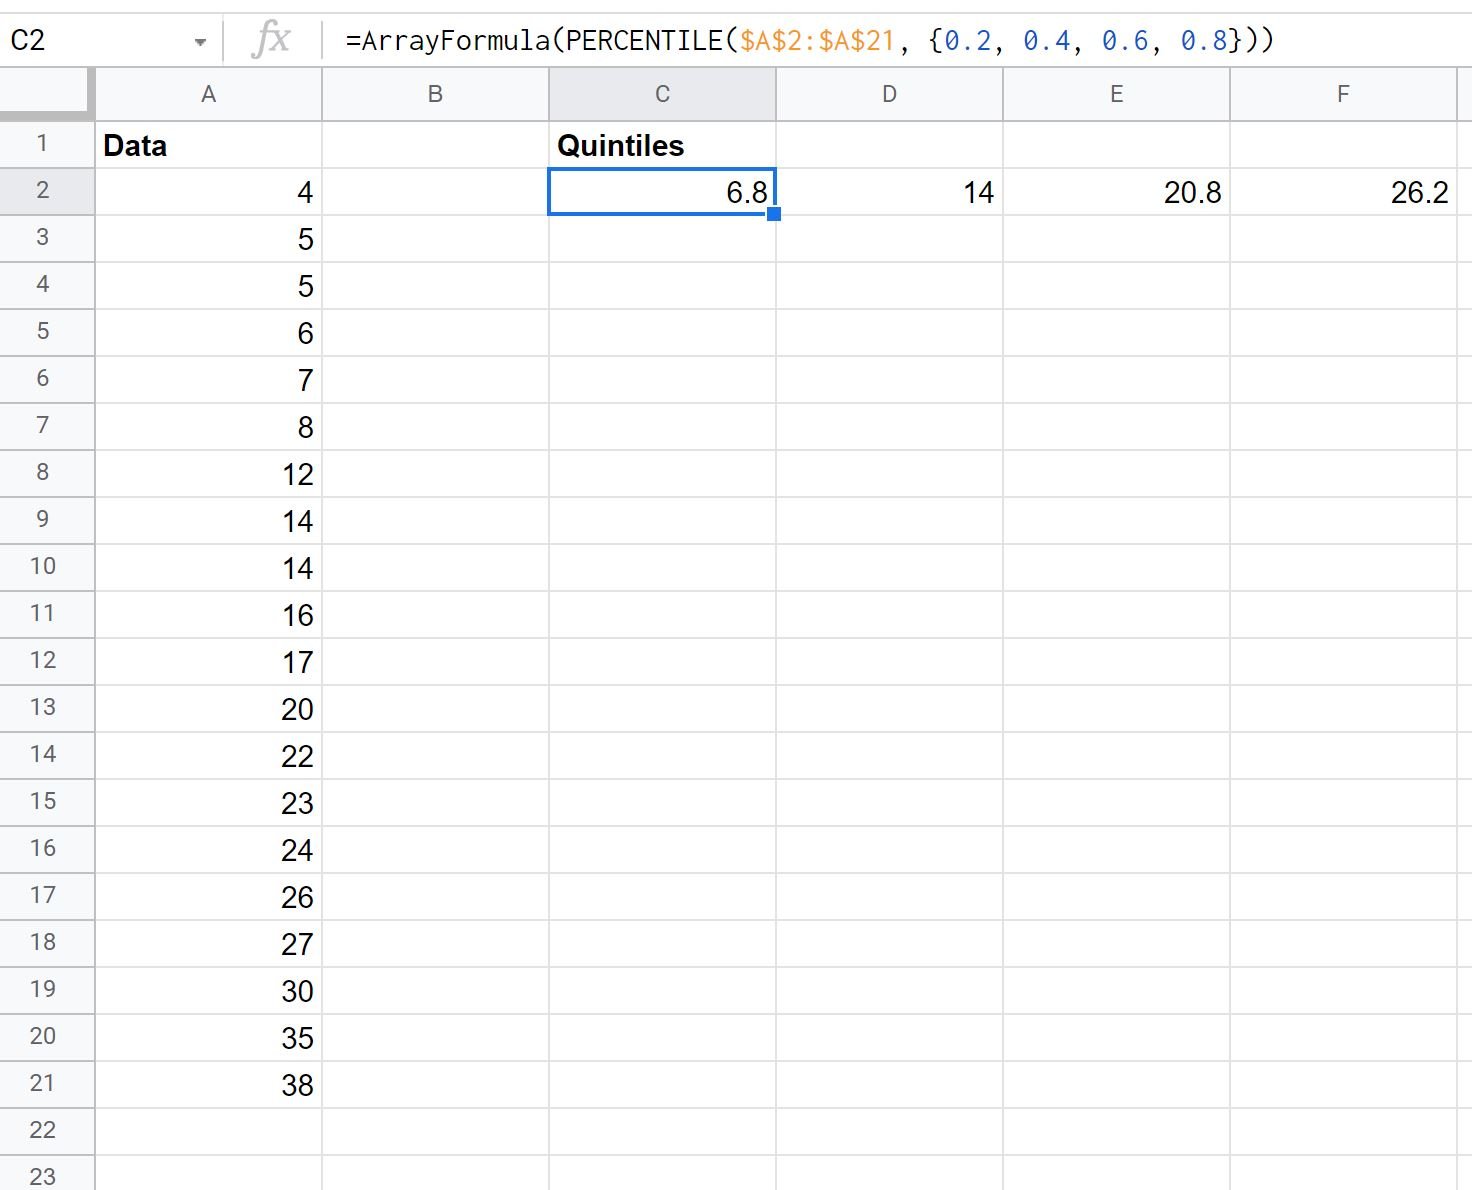
Notice that these quintile values match the ones we calculated earlier.
Additional Resources
The following tutorials explain how to perform other common tasks in Google Sheets:
How to Calculate a Five Number Summary in Google Sheets
How to Calculate the Interquartile Range in Google Sheets
How to Calculate Deciles in Google Sheets