You can use the value_counts() function in pandas to count the occurrences of values in a given column of a DataFrame.
You can use one of the following methods to plot the values produced by the value_counts() function:
Method 1: Plot Value Counts in Descending Order
df.my_column.value_counts().plot(kind='bar')
Method 2: Plot Value Counts in Ascending Order
df.my_column.value_counts().sort_values().plot(kind='bar')
Method 3: Plot Value Counts in Order They Appear in DataFrame
df.my_column.value_counts()[df.my_column.unique()].plot(kind='bar')
The following examples show how to use each method in practice with the following pandas DataFrame:
import pandas as pd

#create DataFrame
df = pd.DataFrame({'team': ['A', 'A', 'B', 'B', 'B', 'B', 'B', 'C'],
                   'points': [15, 12, 18, 20, 22, 28, 35, 40]})

#view DataFrame
print(df)

  team  points
0    A      15
1    A      12
2    B      18
3    B      20
4    B      22
5    B      28
6    B      35
7    C      40

#calculate occurrences of each value in 'team' column
df.team.value_counts()

B    5
A    2
C    1
Name: team, dtype: int64
Example 1: Plot Value Counts in Descending Order
The following code shows how to plot the value counts in a bar chart in descending order:
#plot value counts of team in descending order
df.team.value_counts().plot(kind='bar')
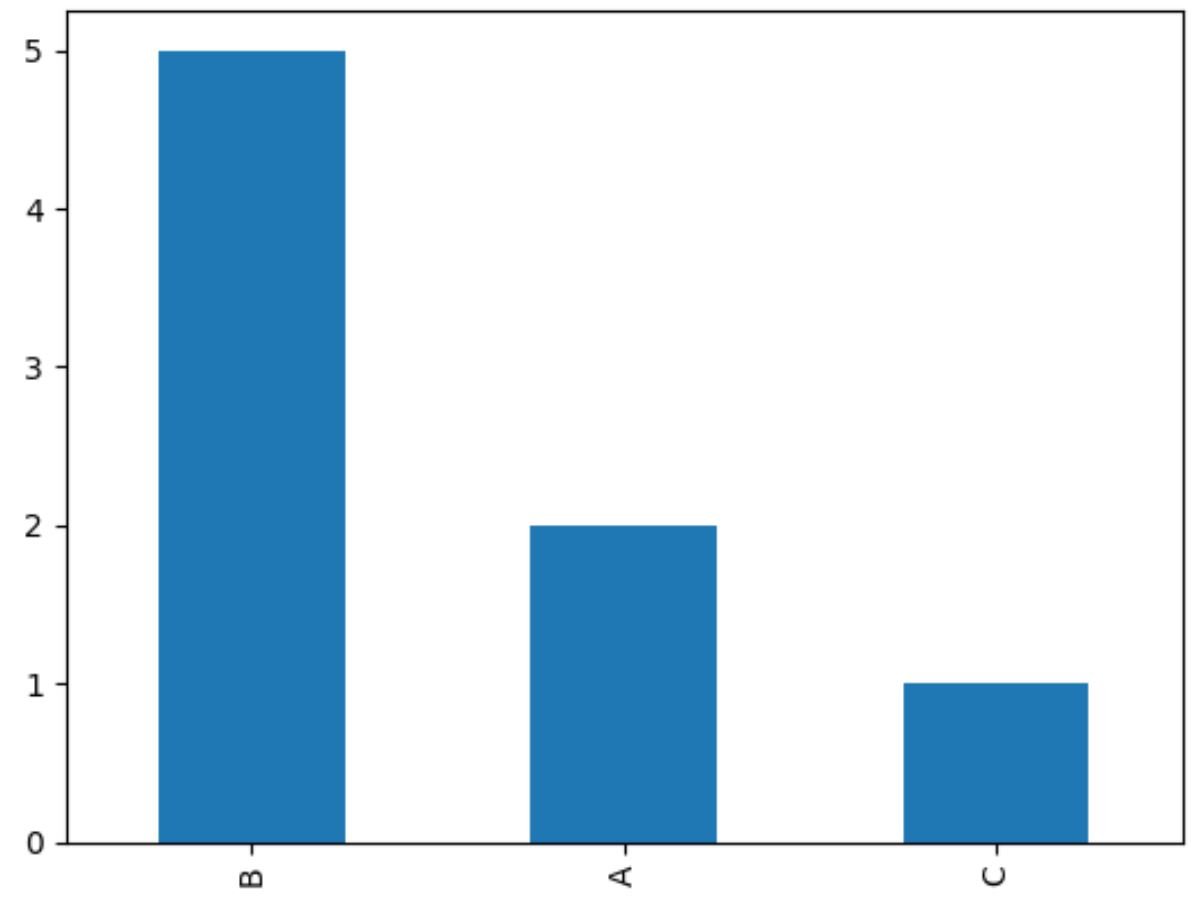
The x-axis displays the team name and the y-axis displays the frequency of each team.
Notice that the bars are sorted in descending order by default.
Note: If you’d like to create a horizontal bar chart instead, simply replace bar with barh in the kind argument.
Example 2: Plot Value Counts in Ascending Order
The following code shows how to plot the value counts in a bar chart in ascending order:
#plot value counts of team in descending order
df.team.value_counts().sort_values().plot(kind='bar')
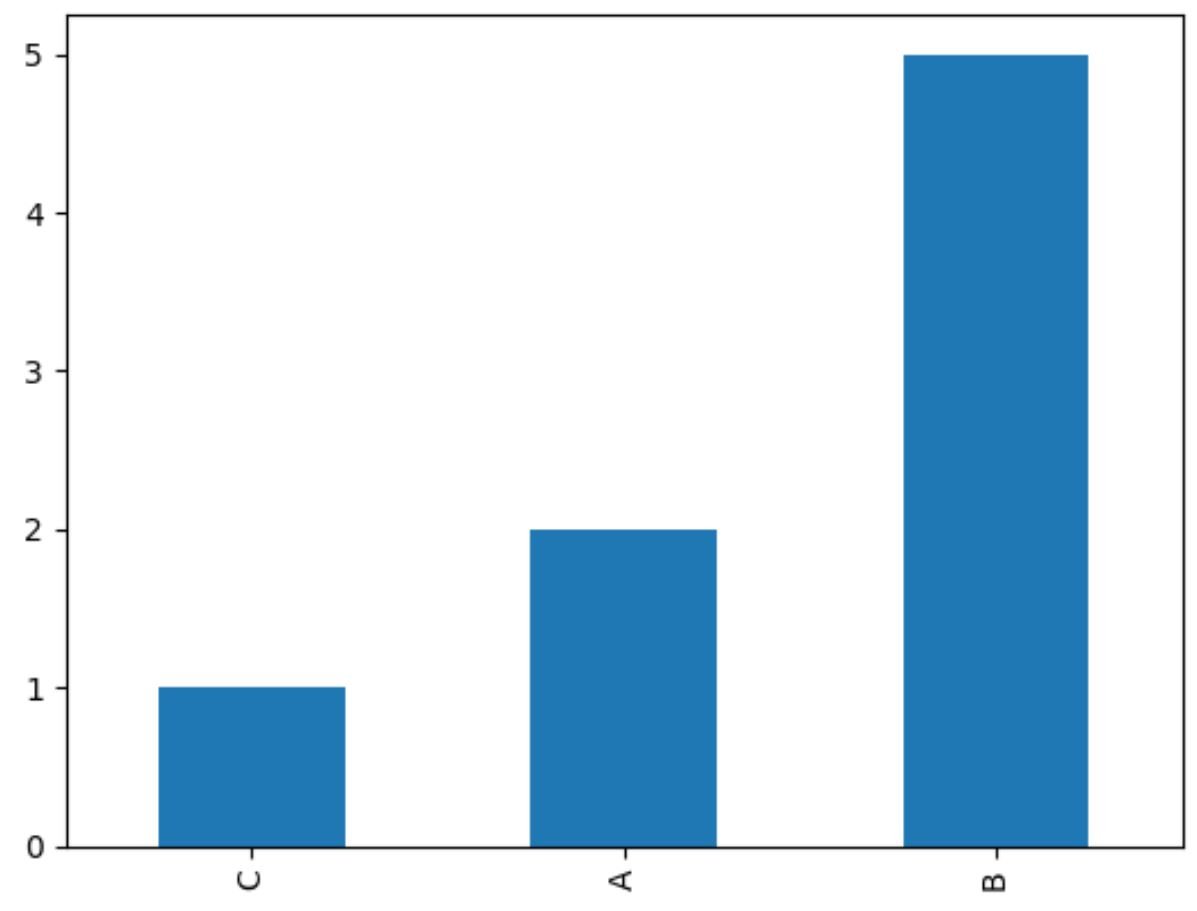
Notice that the bars are now sorted in ascending order.
Example 3: Plot Value Counts in Order They Appear in DataFrame
The following code shows how to plot the value counts in a bar chart based on the order they appear in the DataFrame:
#plot value counts of team in order they appear in DataFrame
df.team.value_counts()[df.team.unique()].plot(kind='bar')
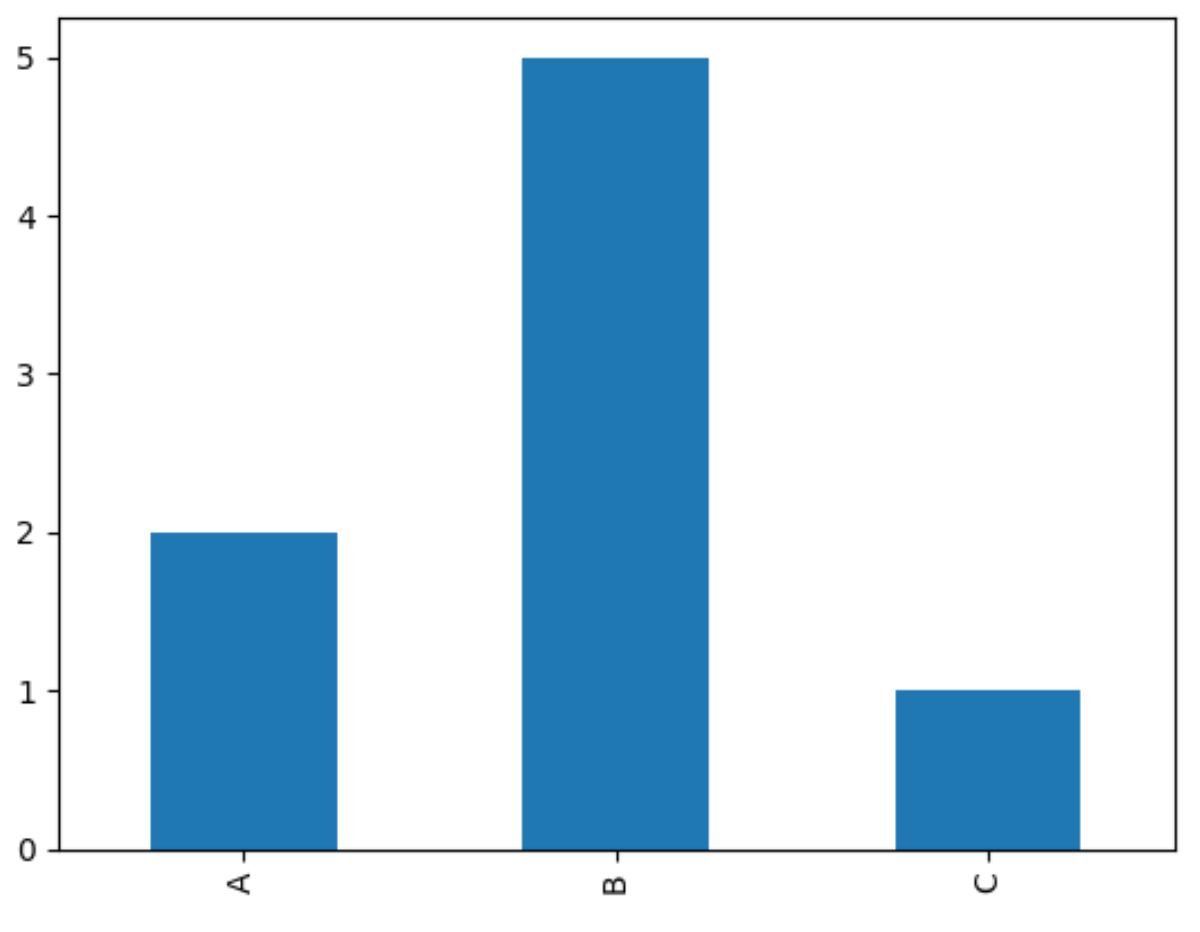
The bars are now sorted based on the order in which they appear in the DataFrame.
For example, the value ‘A’ occurs first in the team column, then ‘B’ occurs, then ‘C’ occurs.
Thus, this is the order the bars are placed in the bar chart.
Additional Resources
The following tutorials explain how to perform other common tasks in pandas:
Pandas: How to Add Titles to Plots
Pandas: How to Create Plot Legends
Pandas: How to Create Bar Plot from GroupBy