You can use the following basic syntax to create a histogram from a pandas DataFrame:
df.hist(column='col_name')
The following examples show how to use this syntax in practice.
Example 1: Plot a Single Histogram
The following code shows how to create a single histogram for a particular column in a pandas DataFrame:
import pandas as pd

#create DataFrame
df = pd.DataFrame({'points': [25, 12, 15, 14, 19, 23, 25, 29, 29, 31, 31, 33],
                   'assists': [5, 7, 7, 9, 12, 9, 9, 4, 7, 7, 8, 9],
                   'rebounds': [11, 8, 10, 6, 6, 5, 9, 12, 10, 7, 7, 9]})

#view first five rows of DataFrame
df.head()

	points	assists	rebounds
0	25	5	11
1	12	7	8
2	15	7	10
3	14	9	6
4	19	12	6

#create histogram for 'points' column
df.hist(column='points')

We can also customize the histogram with specific colors, styles, labels, and number of bins:
#create custom histogram for 'points' column
df.hist(column='points', bins=5, grid=False, rwidth=.9, color='purple')
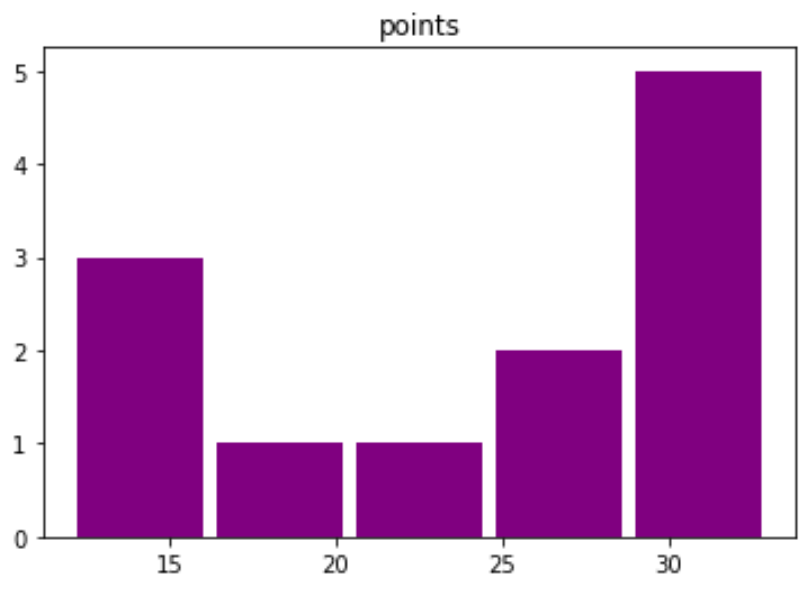
The x-axis displays the points scored per player and the y-axis shows the frequency for the number of players who scored that many points.
Example 2: Plot Multiple Histograms
The following code shows how to plot multiple histograms from a pandas DataFrame:
import pandas as pd

#create DataFrame
df = pd.DataFrame({'team':['A', 'A', 'A', 'A', 'A', 'A',
                           'B', 'B', 'B', 'B', 'B', 'B'],
                   'points': [25, 12, 15, 14, 19, 23, 25, 29, 29, 31, 31, 33]})

#view first five rows
df.head()

        team	points
0	A	25
1	A	12
2	A	15
3	A	14
4	A	19

#create histogram for each team
df.hist(column='points', by='team', bins=3, grid=False, rwidth=.9,
        color='purple', sharex=True)
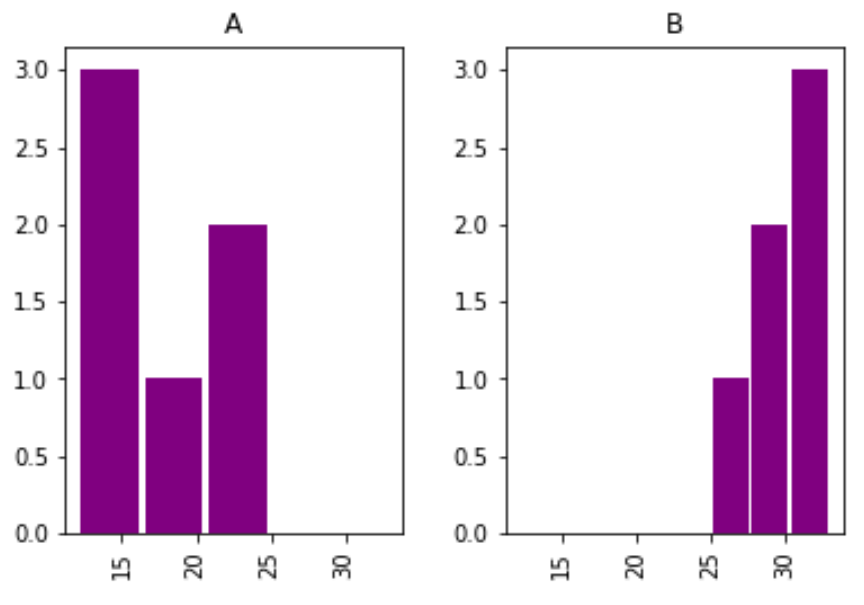
Note that the sharex argument specifies that the two histograms should share the same x-axis.
This makes it easier to compare the distribution of values between the two histograms.
Additional Resources
The following tutorials explain how to create other common plots in Python:
How to Plot Multiple Lines in Matplotlib
How to Create Boxplot from Pandas DataFrame
How to Plot Multiple Pandas Columns on Bar Chart