You can use the figsize parameter to quickly adjust the figure size of a plot in pandas:
df.plot.scatter(x='x', y='y', figsize=(8,4))
The first value in the figsize parameter specifies the width and the second value specifies the height of the plot.
The following examples show how to use this parameter in practice with the following pandas DataFrame:
import pandas as pd

#create DatFrame
df = pd.DataFrame({'x': [1, 2, 3, 4, 5, 6, 7, 8, 9, 10],
                   'y': [5, 7, 7, 9, 10, 14, 13, 15, 19, 16]})

#view head of DataFrame
df.head()

        x	y
0	1	5
1	2	7
2	3	7
3	4	9
4	5	10
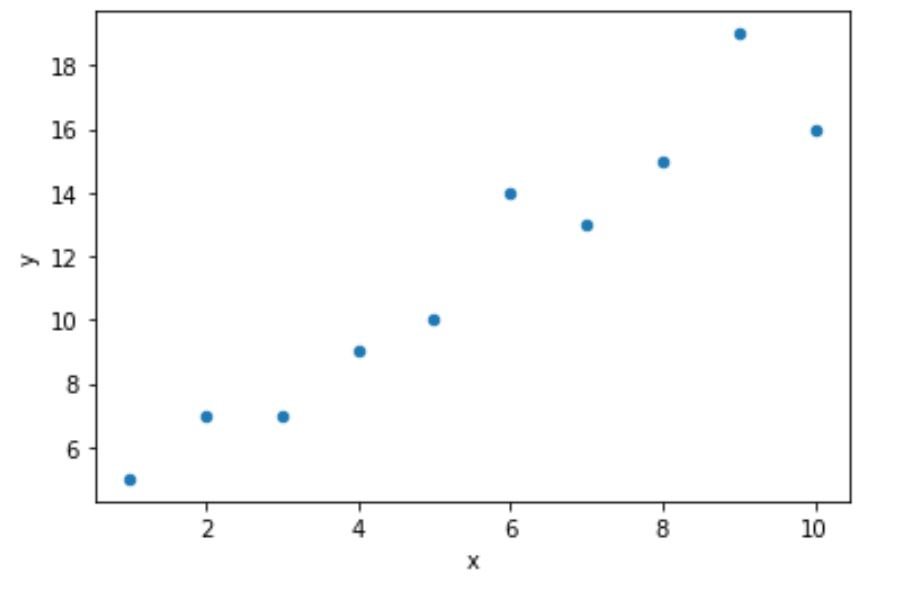
Example 1: Create Plot with Default Size
The following code shows how to create a scatter plot in pandas using the default plot size:
#create scatter plot with default size
df.plot.scatter(x='x', y='y')
Example 2: Create Horizontal Plot
The following code shows how to create a scatter plot in pandas in which the width is twice as long as the height:
#create scatter plot with longer width than height
df.plot.scatter(x='x', y='y', figsize=(8,4))
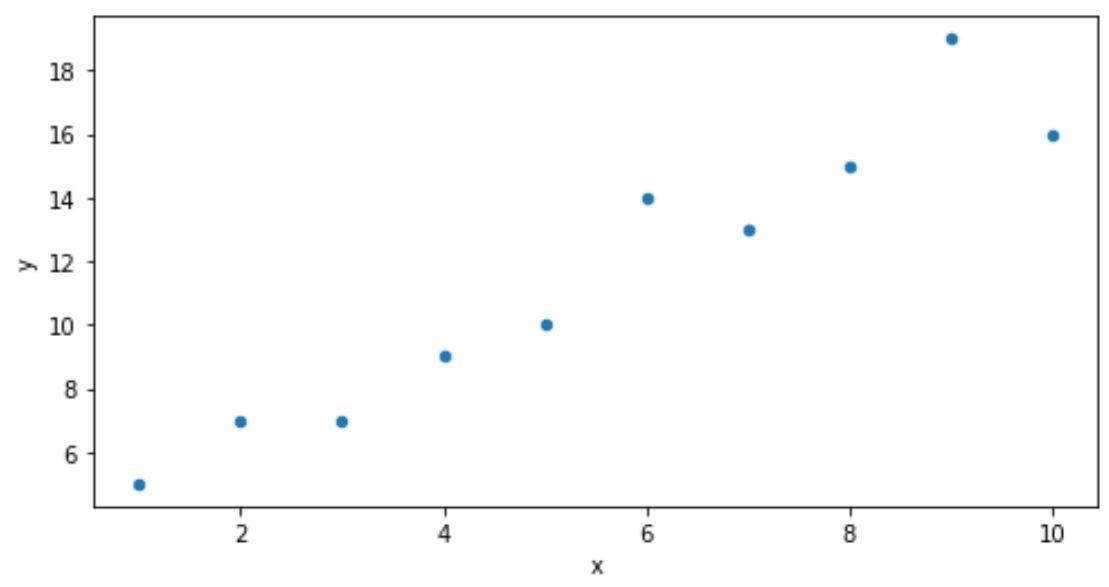
Notice that the plot is much wider than it is tall.
Example 3: Create Vertical Plot
The following code shows how to create a scatter plot in pandas in which the height is twice as long as the width:
#create scatter plot with longer height than width
df.plot.scatter(x='x', y='y', figsize=(4,8))

Notice that the plot is much taller than it is wide.
Additional Resources
The following tutorials explain how to perform other common tasks in pandas:
Pandas: How to Add Titles to Plots
Pandas: How to Create Plot Legends
Pandas: How to Create Bar Plot from GroupBy