A cumulative distribution function (CDF) tells us the probability that a random variable takes on a value less than or equal to some value.
This tutorial explains how to calculate and plot values for the normal CDF in Python.
Example 1: Calculate Normal CDF Probabilities in Python
The easiest way to calculate normal CDF probabilities in Python is to use the norm.cdf() function from the SciPy library.
The following code shows how to calculate the probability that a random variable takes on a value less than 1.96 in a standard normal distribution:
from scipy.stats import norm

#calculate probability that random value is less than 1.96 in normal CDF
norm.cdf(1.96)

0.9750021048517795
The probability that a random variables takes on a value less than 1.96 in a standard normal distribution is roughly 0.975.
We can also find the probability that a random variable takes on a value greater than 1.96 by simply subtracting this value from 1:
from scipy.stats import norm

#calculate probability that random value is greater than 1.96 in normal CDF
1 - norm.cdf(1.96)

0.024997895148220484
The probability that a random variables takes on a value greater than 1.96 in a standard normal distribution is roughly 0.025.
Example 2: Plot the Normal CDF
The following code shows how to plot a normal CDF in Python:
import matplotlib.pyplot as plt
import numpy as np
import scipy.stats as ss

#define x and y values to use for CDF
x = np.linspace(-4, 4, 1000)
y = ss.norm.cdf(x)

#plot normal CDF
plt.plot(x, y)
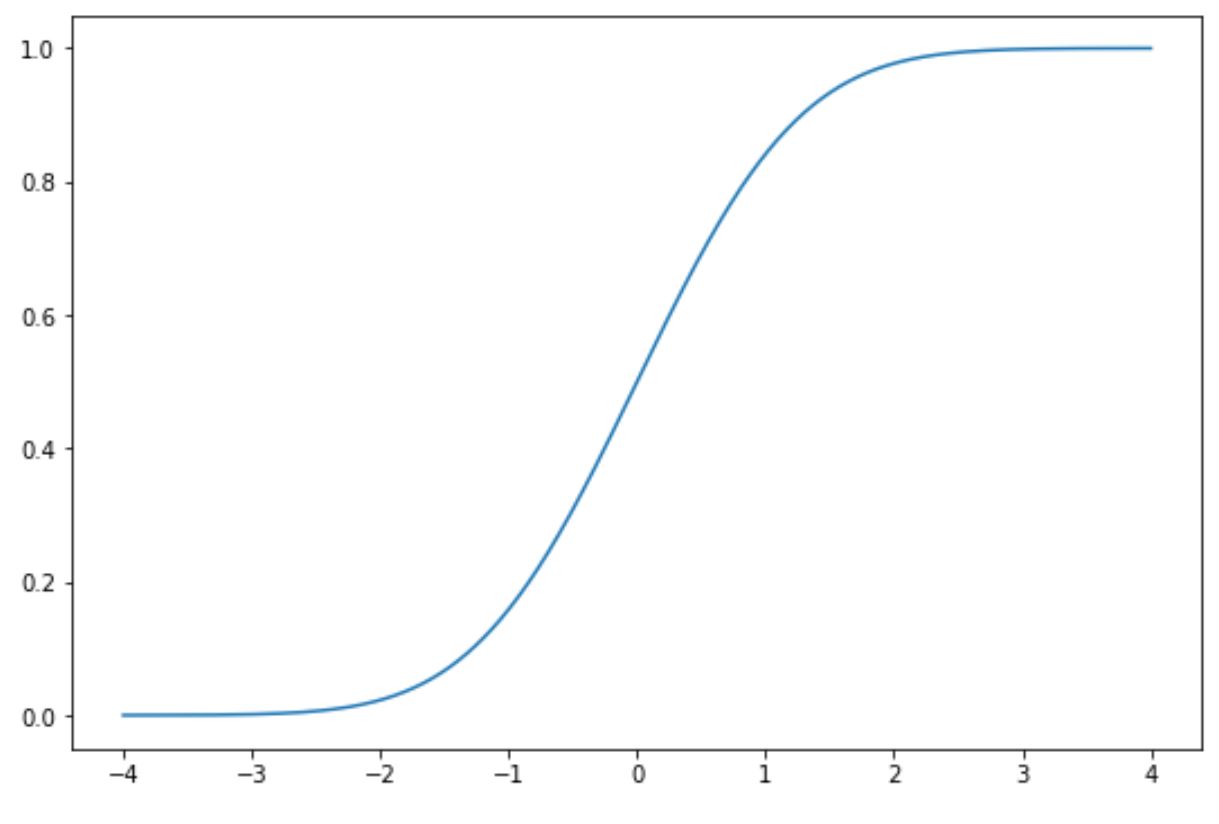
The x-axis shows the values of a random variable that follows a standard normal distribution and the y-axis shows the probability that a random variable takes on a value less than the value shown on the x-axis.
For example, if we look at x = 1.96 then we’ll see that the cumulative probability that x is less than 1.96 is roughly 0.975.
Feel free to modify the colors and the axis labels of the normal CDF plot as well:
import matplotlib.pyplot as plt
import numpy as np
import scipy.stats as ss

#define x and y values to use for CDF
x = np.linspace(-4, 4, 1000)
y = ss.norm.cdf(x)

#plot normal CDF
plt.plot(x, y, color='red')
plt.title('Normal CDF')
plt.xlabel('x')
plt.ylabel('CDF')

Additional Resources
The following tutorials explain how to perform other common operations in Python:
How to Generate a Normal Distribution in Python
How to Plot a Normal Distribution in Python