You can use the following basic syntax to reverse the x-axis and y-axis in Matplotlib:
plt.gca().invert_xaxis()
plt.gca().invert_yaxis()
The following example shows how to use this syntax in practice.
Example: Reverse Axes in Matplotlib
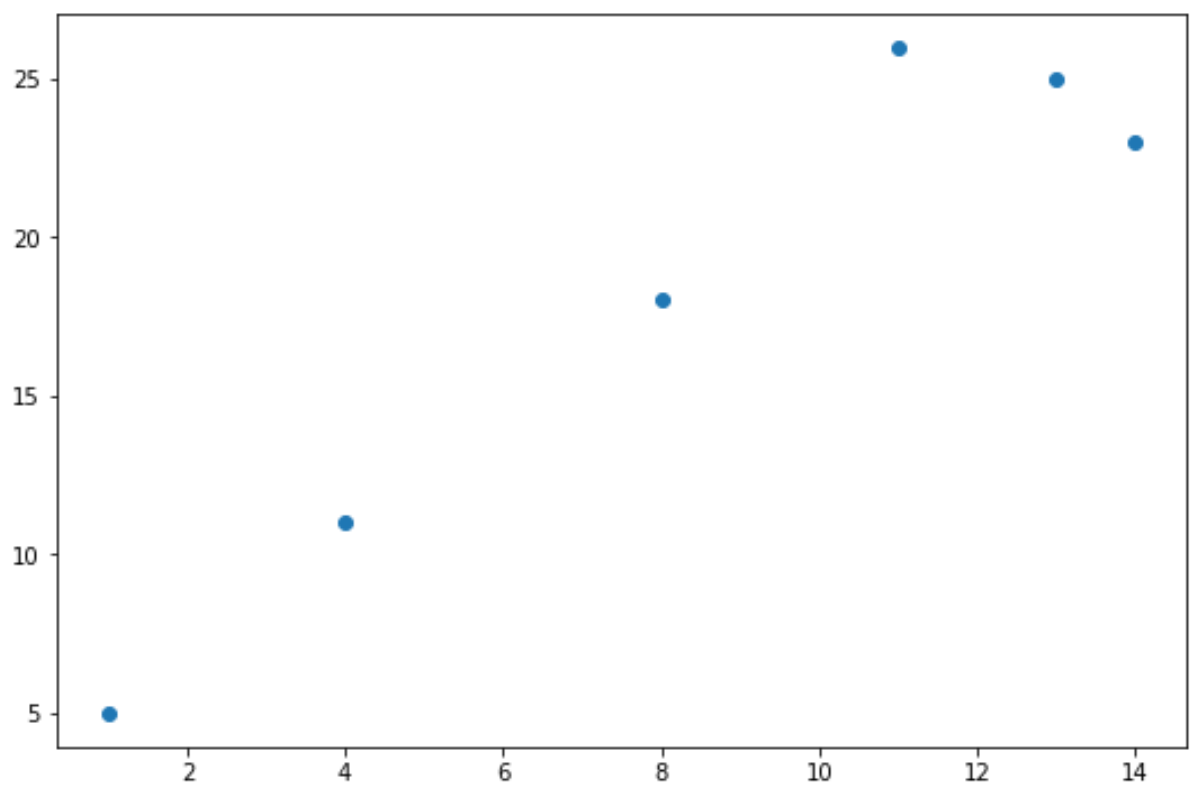
The following code shows how to create a basic scatterplot in Matplotlib:
import matplotlib.pyplot as plt

#define x and y
x = [1, 4, 8, 11, 13, 14]
y = [5, 11, 18, 26, 25, 23]

#create scatterplot of x and y
plt.scatter(x, y)
We can use the following code to reverse the y-axis:
import matplotlib.pyplot as plt

#define x and y
x = [1, 4, 8, 11, 13, 14]
y = [5, 11, 18, 26, 25, 23]

#create scatterplot of x and y
plt.scatter(x, y)

#reverse y-axis
plt.gca().invert_yaxis()
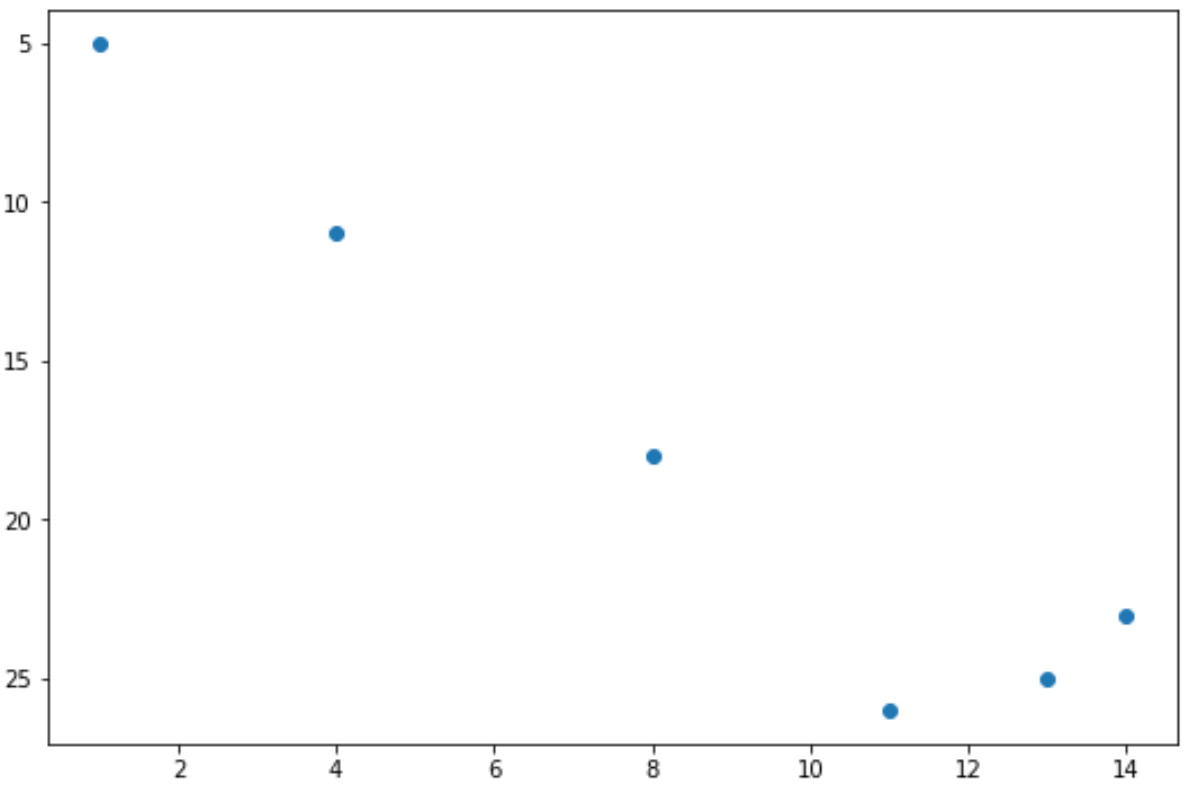
Notice that the y-axis now ranges from 25 to 5 instead of 5 to 25.
Alternatively, we could use the following code to reverse the x-axis:
import matplotlib.pyplot as plt

#define x and y
x = [1, 4, 8, 11, 13, 14]
y = [5, 11, 18, 26, 25, 23]

#create scatterplot of x and y
plt.scatter(x, y)

#reverse x-axis
plt.gca().invert_xaxis()
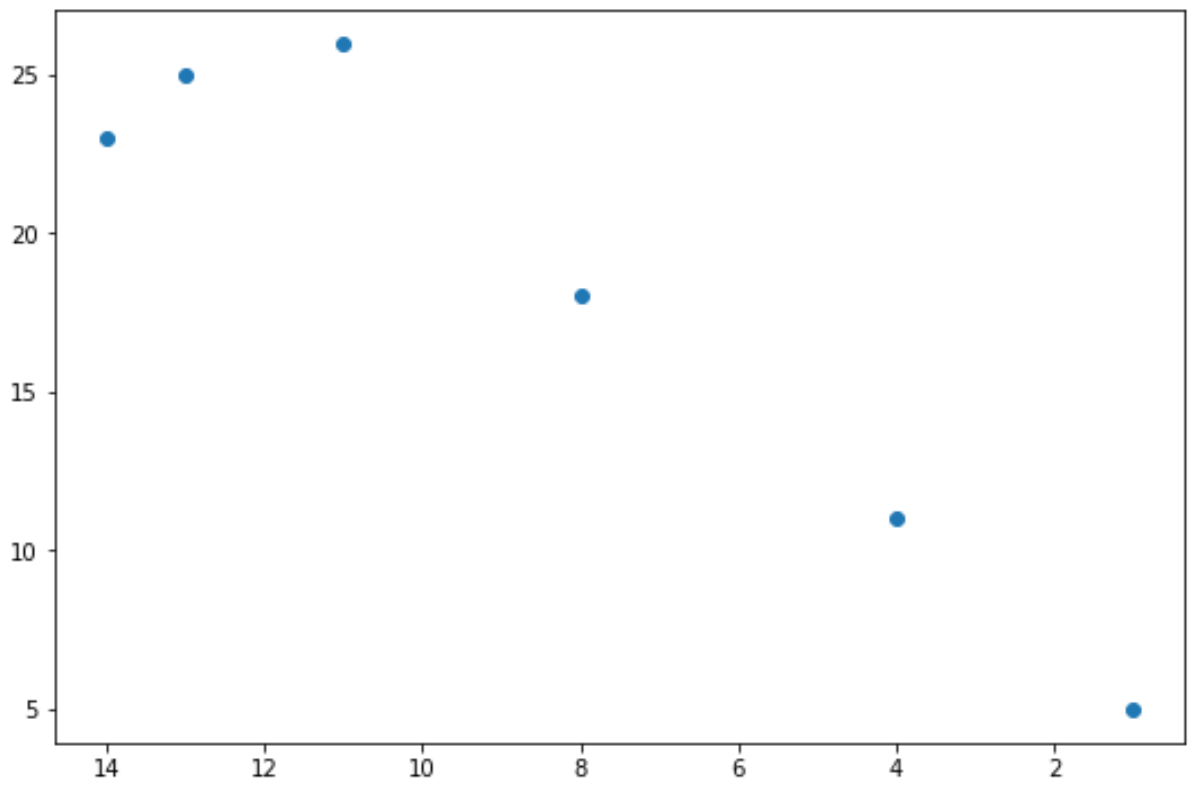
Notice that the x-axis now ranges from 14 to 0 instead of 0 to 14.
Lastly, we could use the following code to reverse both axes:
import matplotlib.pyplot as plt

#define x and y
x = [1, 4, 8, 11, 13, 14]
y = [5, 11, 18, 26, 25, 23]

#create scatterplot of x and y
plt.scatter(x, y)

#reverse both axes
plt.gca().invert_xaxis()
plt.gca().invert_yaxis()
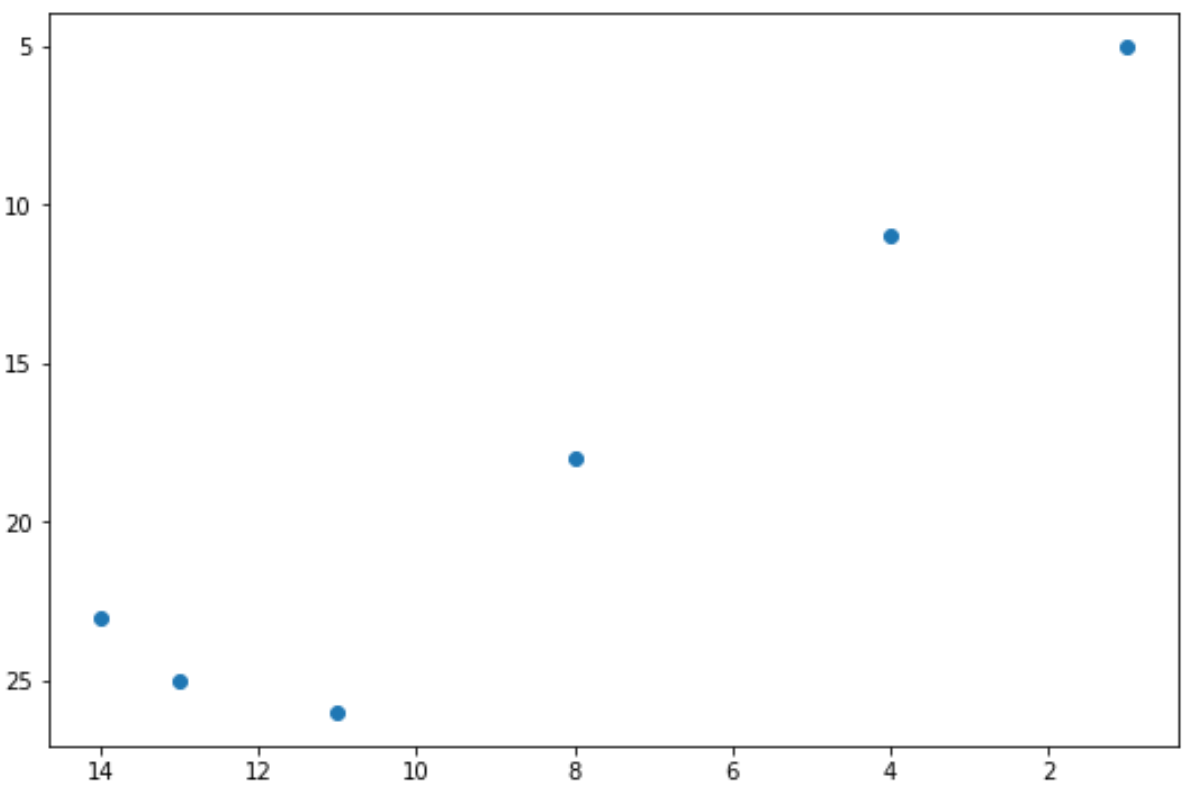
Notice that both axes values are reversed.
Additional Resources
The following tutorials explain how to perform other common operations in Matplotlib:
How to Set Axis Ranges in Matplotlib
How to Set Axis Ticks in Matplotlib
How to Adjust Axis Label Position in Matplotlib