You can use the following basic syntax to generate random colors in Matplotlib plots:
1. Generate Random Color for Line Plot
col = (np.random.random(), np.random.random(), np.random.random())

plt.plot(x, y, c=col)
2. Generate Random Colors for Scatterplot
plt.scatter(x, y, c=np.random.rand(len(x),3))
The following examples show how to use this syntax in practice.
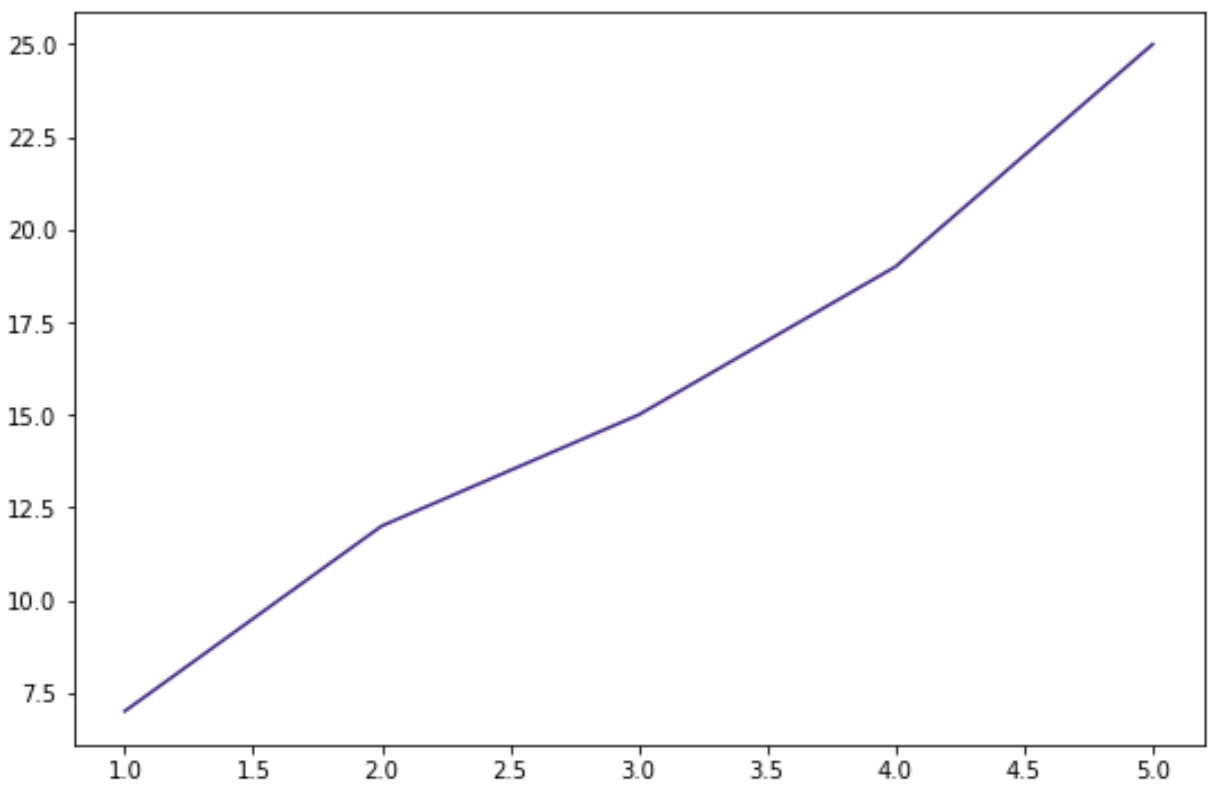
Example 1: Generate Random Color for Line Plot
The following code shows how to generate a random color for a single line in a line plot:
import matplotlib.pyplot as plt
import numpy as np

#define data
x = [1, 2, 3, 4, 5]
y = [7, 12, 15, 19, 25]

#define random color
col = (np.random.random(), np.random.random(), np.random.random())

#create line plot with random color
plt.plot(x, y, c=col)
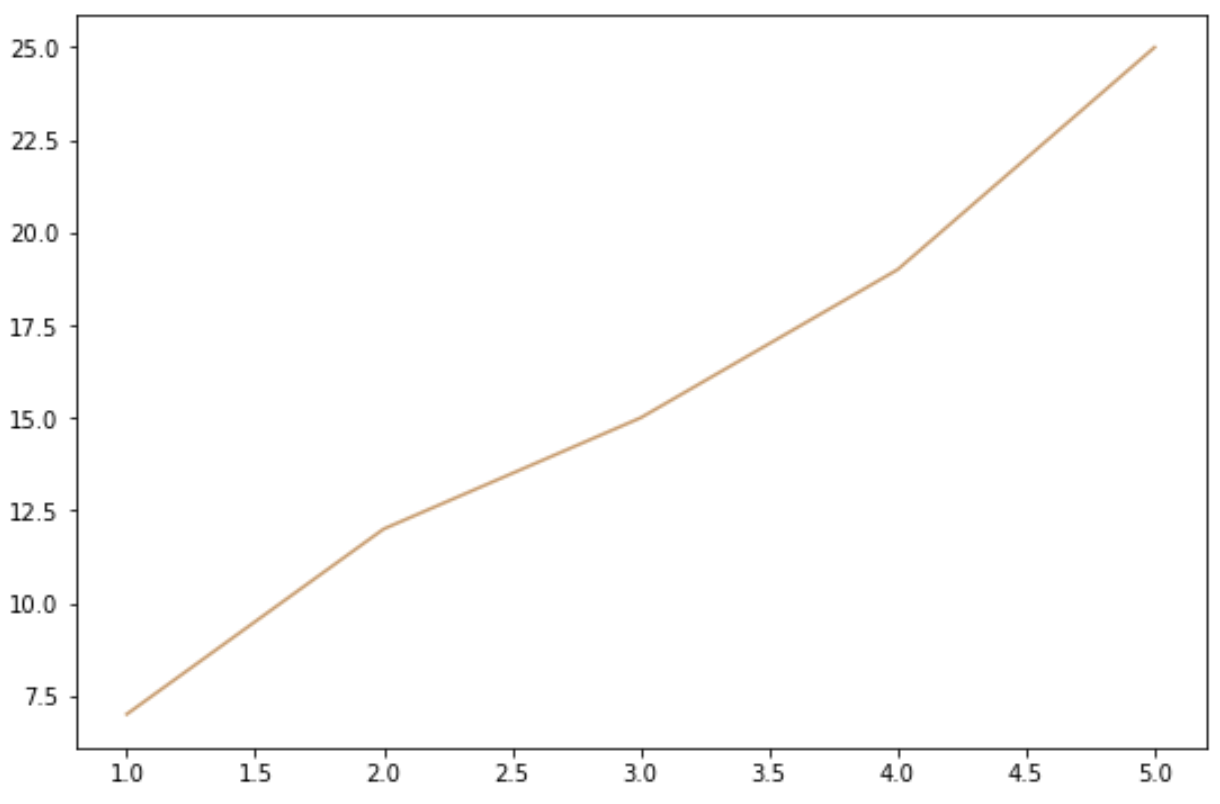
If we run this exact same piece of code again, a line plot with a different random color will be created:
Example 2: Generate Random Colors for Scatterplot
The following code shows how to create a scatterplot with random colors for each point in the plot:
import matplotlib.pyplot as plt
import numpy as np

#define data
x = [1, 2, 3, 4, 5]
y = [7, 12, 15, 19, 25]

#create scatterplot with random colors for each point
plt.scatter(x, y, c=np.random.rand(len(x),3))

If we run this exact same piece of code again, a scatterplot with new random colors for each point will be created:

Note: Under the hood, this code is simply using NumPy to generate random (R,G,B) colors.
Refer to the online documentation for a complete explanation of the NumPy random() function.
Additional Resources
The following tutorials explain how to perform other common plotting functions in Matplotlib:
How to Change Background Color in Matplotlib
How to Color a Scatterplot by Value in Matplotlib