A Mann-Whitney U test (sometimes called the Wilcoxon rank-sum test) is used to compare the differences between two samples when the sample distributions are not normally distributed and the sample sizes are small (n two sample t-test.
This tutorial explains how to perform a Mann-Whitney U test in Stata.
Example: Mann-Whitney U Test in Stata
Researchers want to know if a fuel treatment leads to a change in the average mpg of a car. To test this, they conduct an experiment in which they measure the mpg of 12 cars with the fuel treatment and 12 cars without it.
Because the sample sizes are small and they suspect that the sample distributions are not normally distributed, they decided to perform a Mann-Whitney U test to determine if there is a statistically significant difference in mpg between the two groups.
Perform the following steps to conduct a Mann-Whitney U test in Stata.
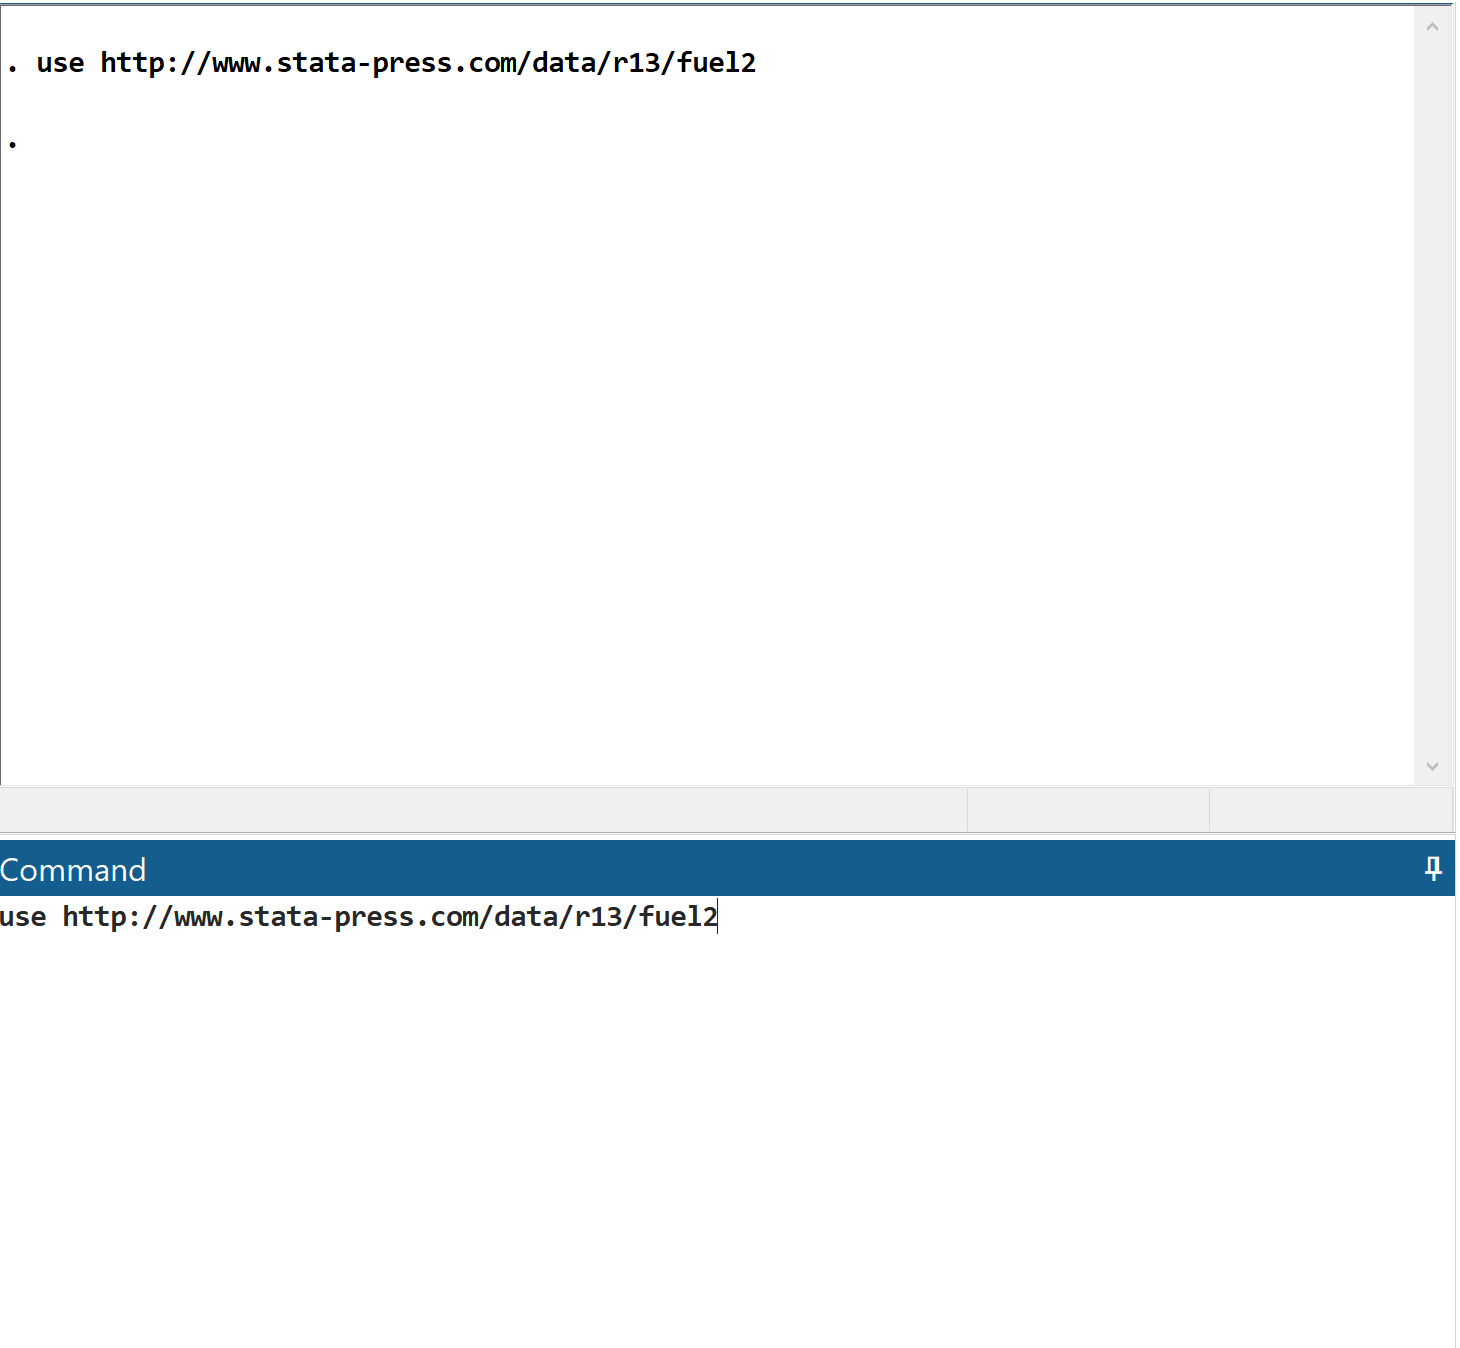
Step 1: Load the data.
First, load the data by typing use http://www.stata-press.com/data/r13/fuel2 in the command box and clicking Enter.
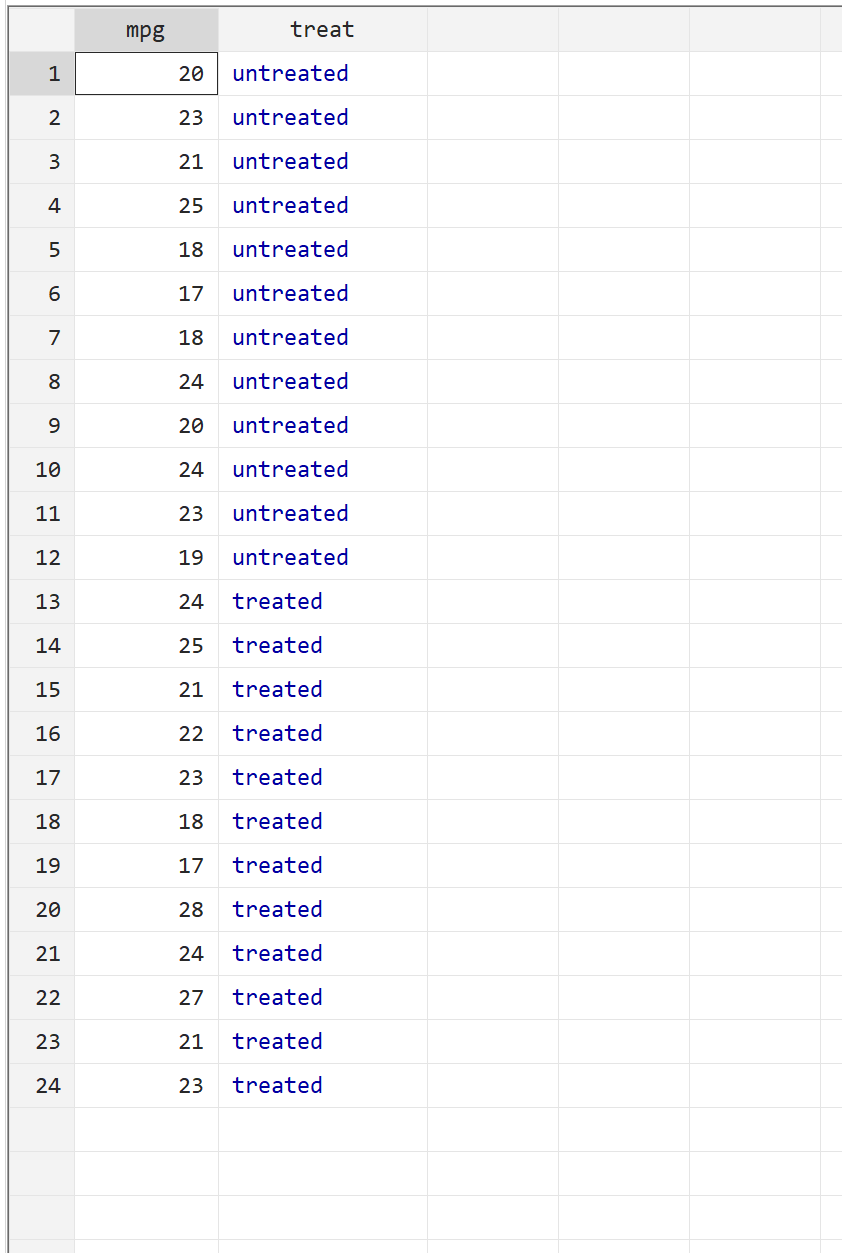
Step 2: View the raw data.
Before we perform the Mann Whitney U test, let’s first view the raw data. Along the top menu bar, go to Data > Data Editor > Data Editor (Browse). The first column, mpg, shows the mpg for a given car while the second column, treat, shows whether or not the car received fuel treatment.
Step 3: Perform a Mann-Whitney U test.
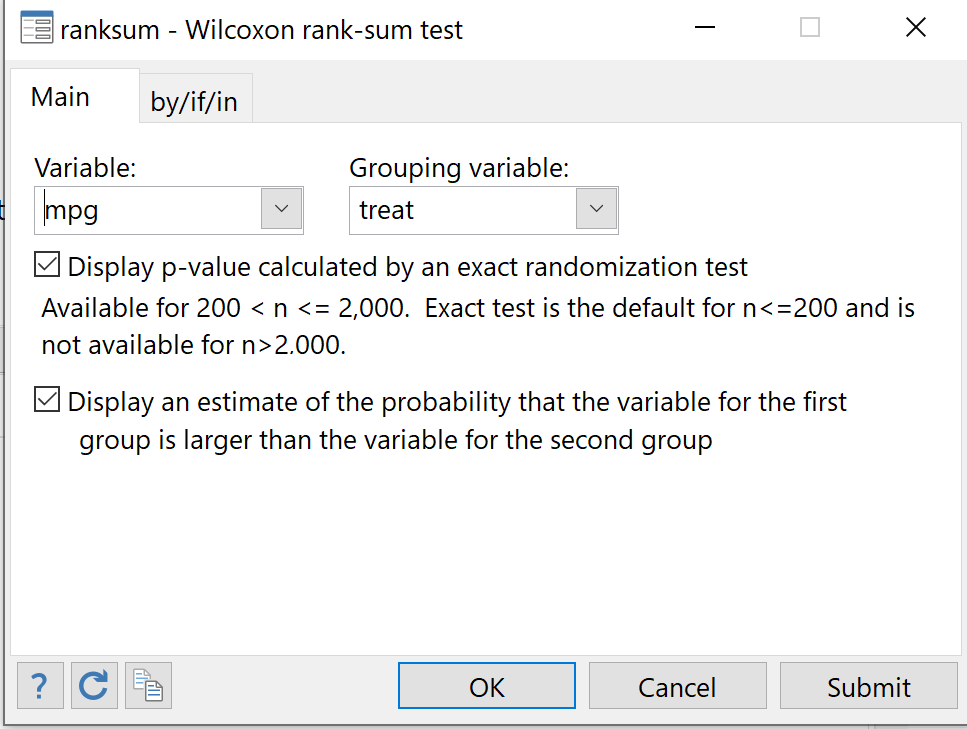
Along the top menu bar, go to Statistics > Summaries, tables, and tests > Nonparametric tests of hypotheses > Wilcoxon rank-sum test.
For Variable, choose mpg. For Grouping variable, choose treat. Check both of the boxes below to display a p-value for an exact test and display an estimate of the probability that the variable for the first group is larger than the variable for the second group. Lastly, click OK.
The results of the test will be displayed:
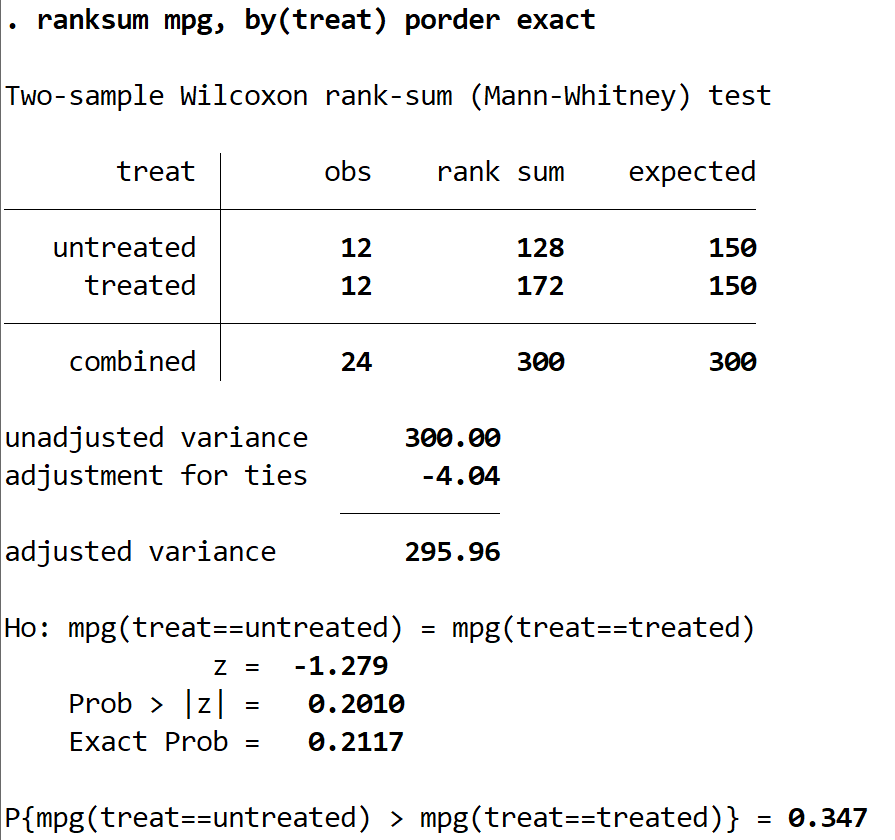
The values that we are primarily interested in are z = -1.279 and Prob > |z| = 0.2010.
Since the p-value of the test (0.2010) is not smaller than our significance level of 0.05, we fail to reject the null hypothesis. We do not have sufficient evidence to say that the true mean mpg is different between the two groups.
Step 5: Report the results.
Lastly, we will report the results of our Mann-Whitney U test. Here is an example of how to do so:
A Mann-Whitney U test was conducted on 24 cars to determine if a new fuel treatment lead to a difference in mean miles per gallon. Each group had 12 cars.
Results showed that the mean mpg was not statistically significantly different between the two groups (z = -1.279, p = .2010) at a significance level of 0.05.
Based on these results, the new fuel treatment does not have a significant impact on the miles per gallon of cars.