Logistic regression is a method we can use to fit a regression model when the response variable is binary.
The following step-by-step example shows how to perform logistic regression in Google Sheets.
Step 1: Install the XLMiner Analysis ToolPak
To perform logistic regression in Google Sheets, we need to first install the free XLMiner Analysis Toolpak.
To do so, click Add-ons > Get add-ons:

Next, type XLMiner Analysis ToolPak in the search bar and click the icon that appears:
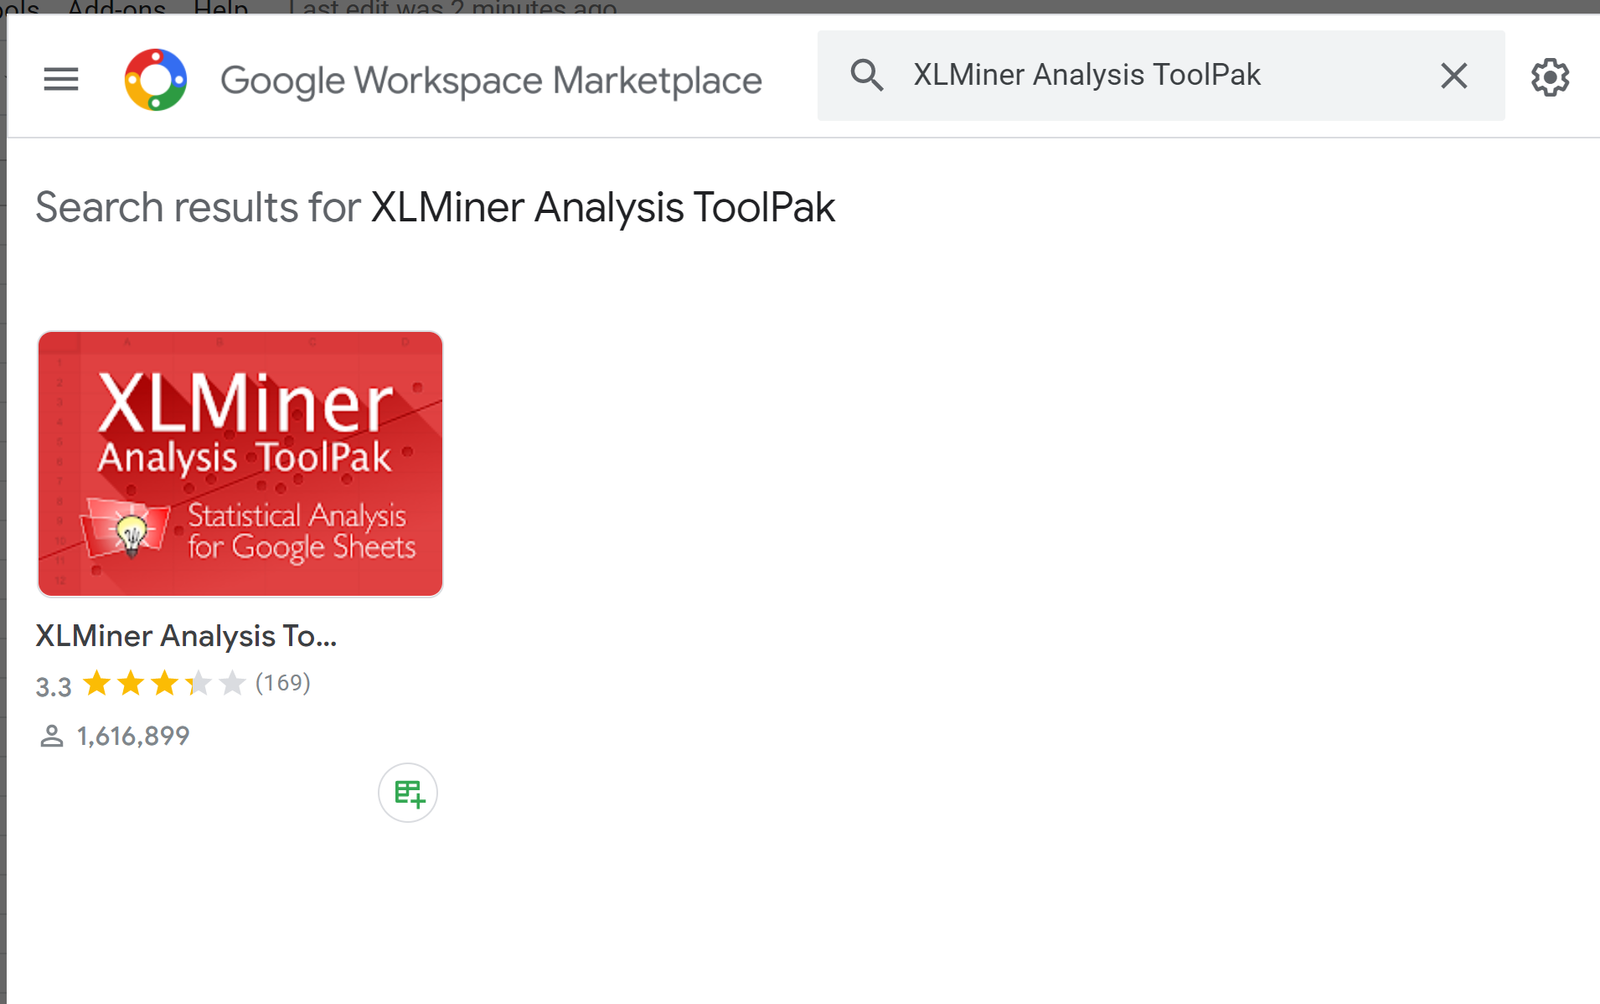
Lastly, click the blue Install button.

Step 2: Enter the Data
Next, we’ll enter the following data into Google Sheets:
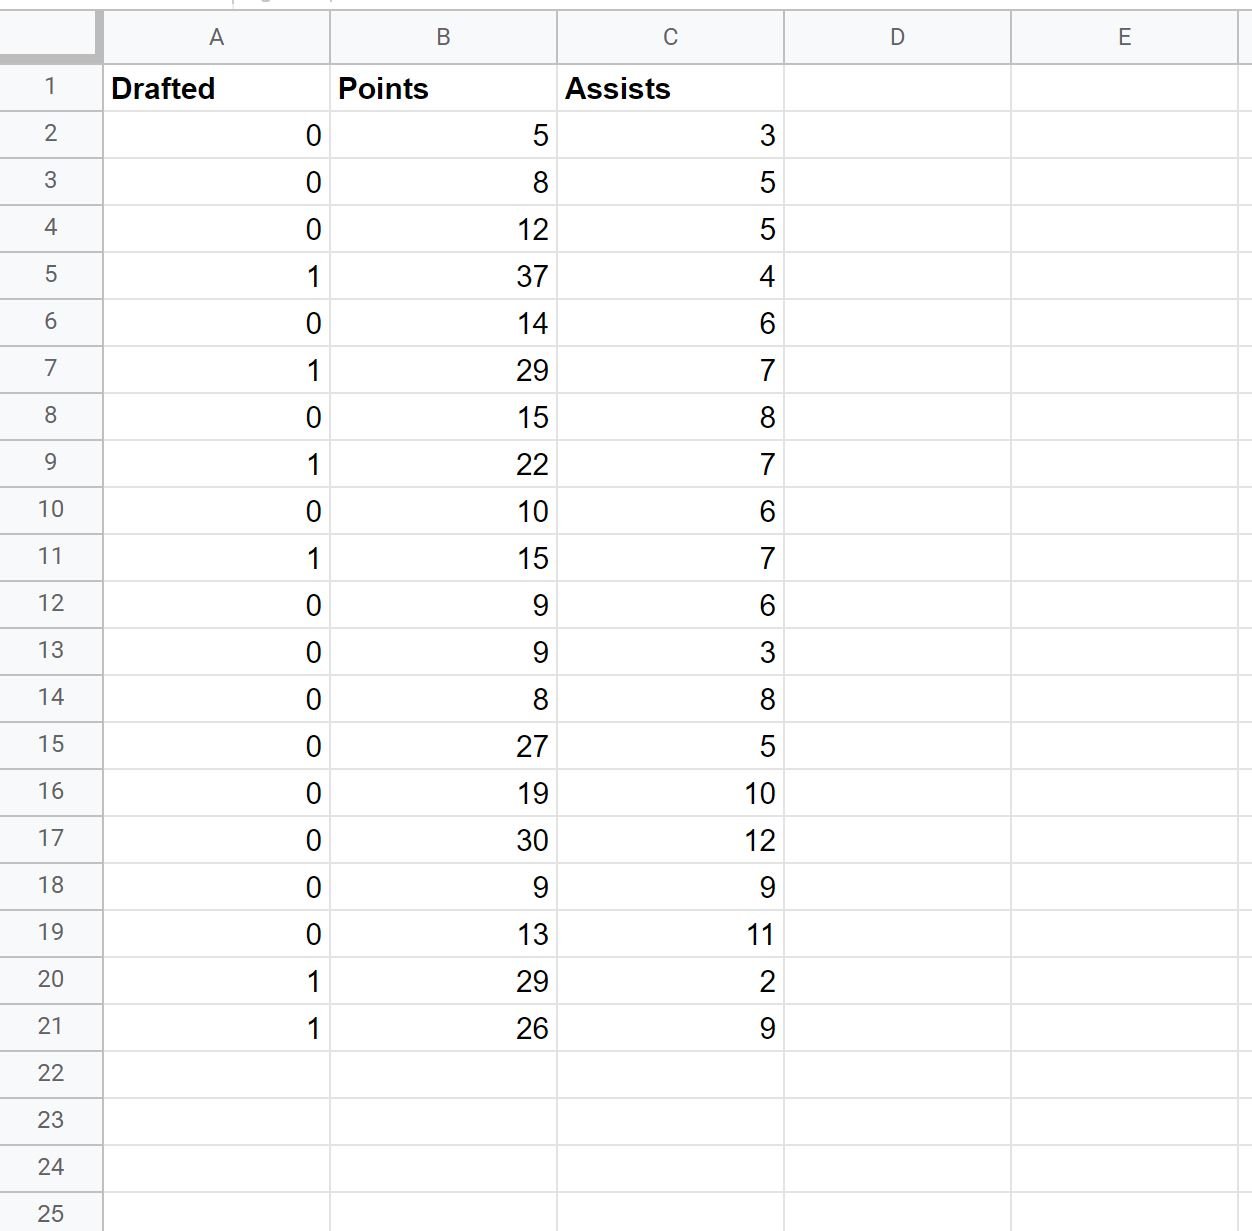
We will fit a logistic regression model that uses points and assists to predict whether a basketball player gets drafted into the NBA (0 =No, 1 = Yes).
Step 3: Perform Logistic Regression
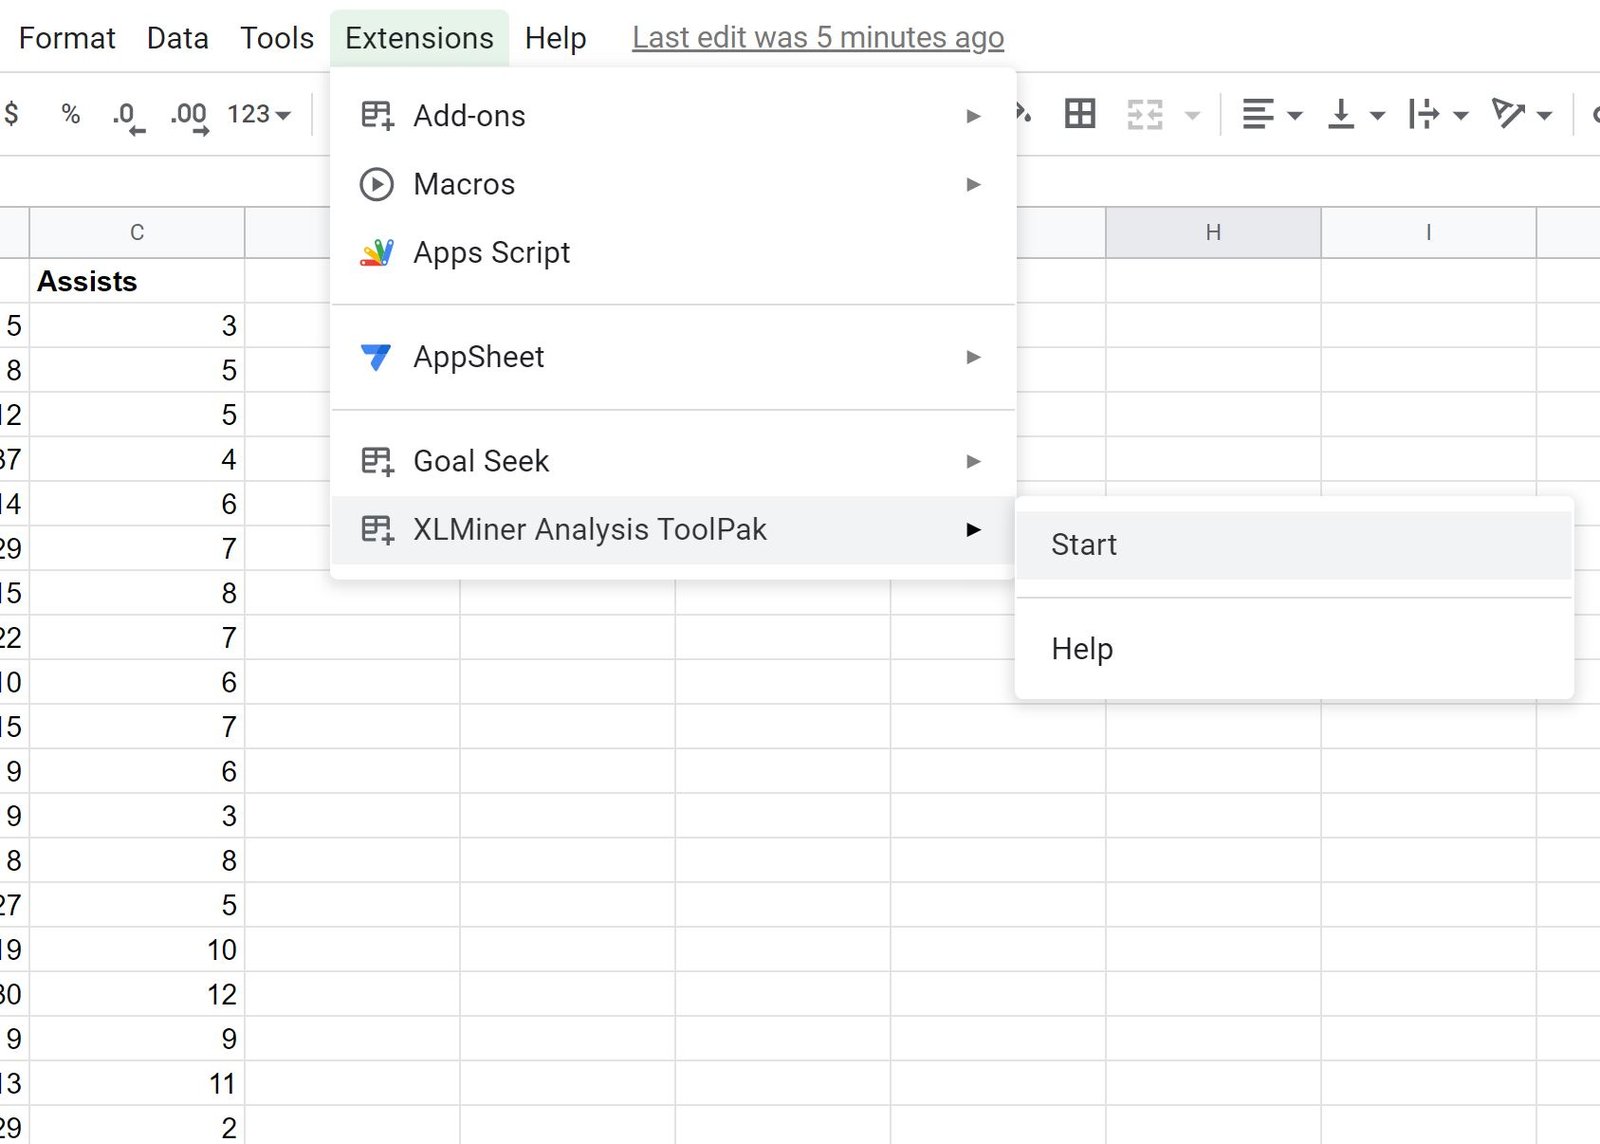
To fit the logistic regression model, click the Extensions tab, then click XL Miner Analysis ToolPak, then click Start:
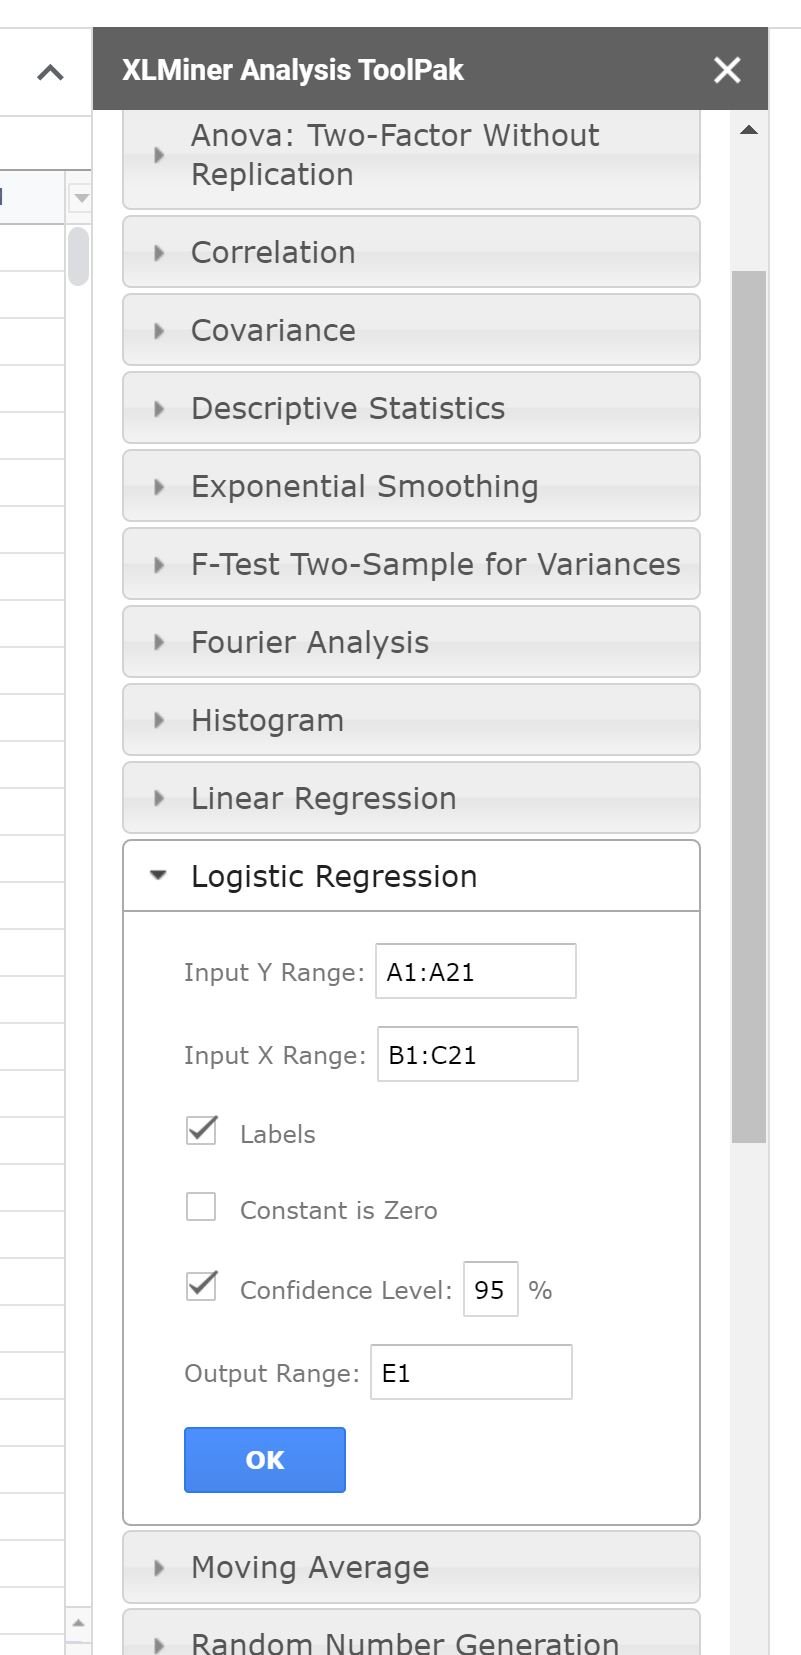
In the panel that appears on the right side of the screen, click the dropdown arrow next to Logistic Regression and type in the following information:
Once you click OK, the summary of the logistic regression model will be displayed:
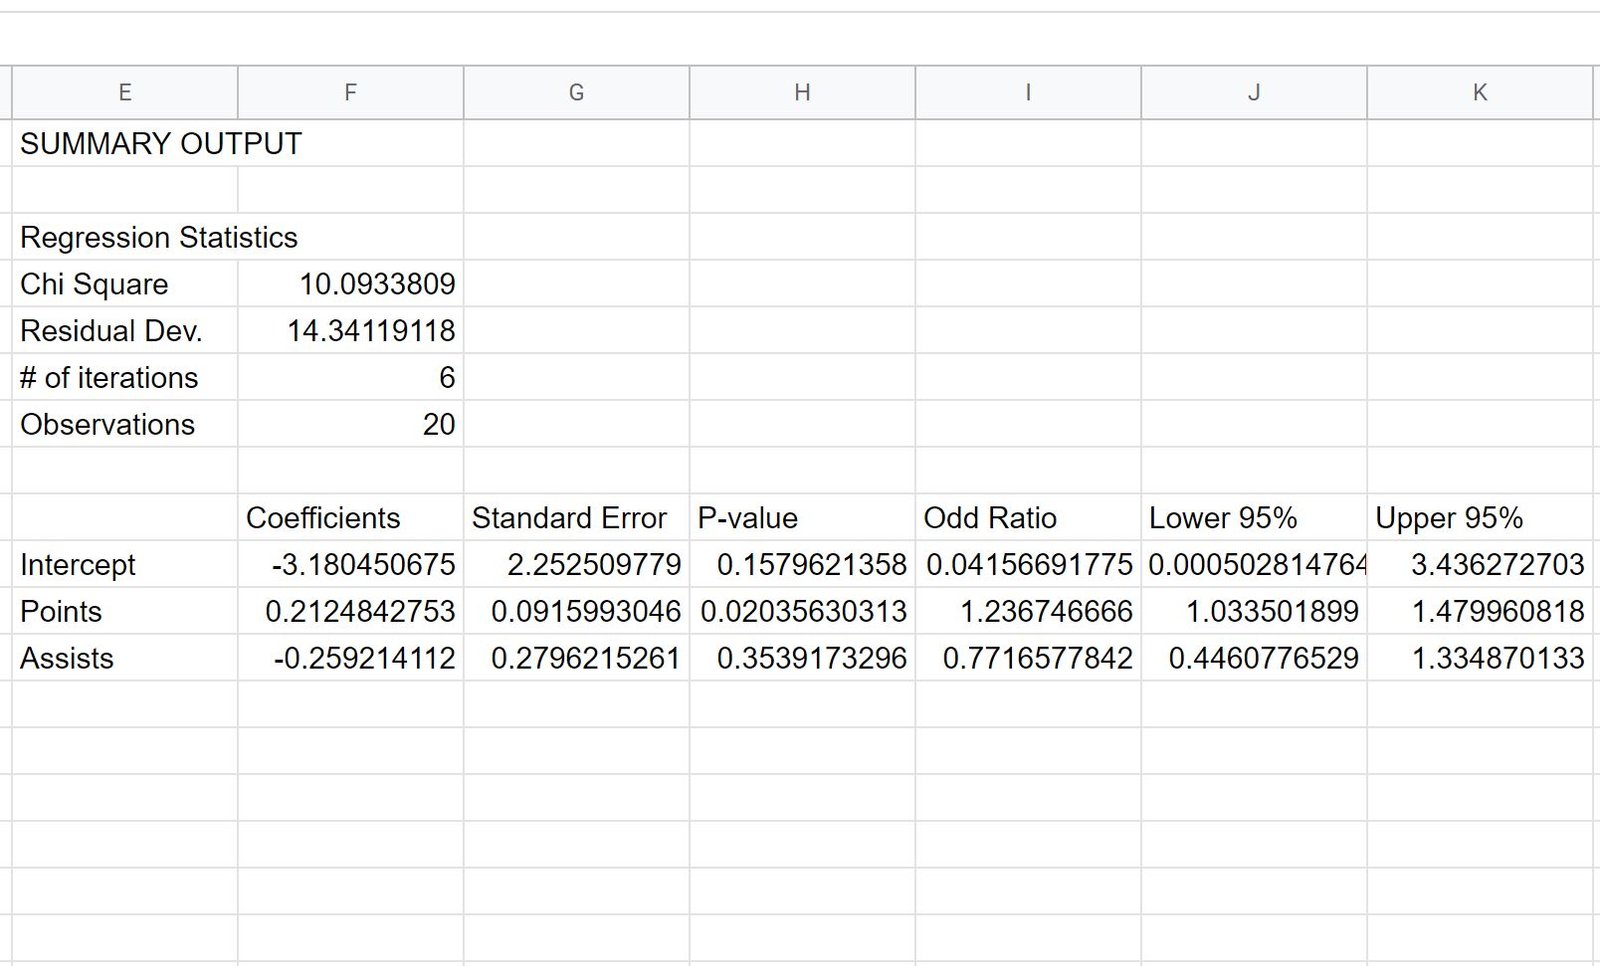
The coefficients in the output indicate the average change in log odds of getting drafted.
For example, a one unit increase in points is associated with an average increase of 0.212 in the log odds of getting drafted.
The sign on the coefficients tells us whether there is a positive or negative associated between each predictor variable and the response variable.
For example, since points has a positive sign for the coefficient it means that increasing the value for points increases the chances that a player gets drafted (assuming assists is held constant).
Conversely, since assists has a negative sign for the coefficient it means that increasing the value for assists decreases the chances that a player gets drafted (assuming points is held constant).
The p-values in the output also give us an idea of how effective each predictor variable is at predicting the probability of getting drafted:
- P-value for points: 0.02
- P-value for assists: 0.35
We can see that points seems to be a statistically significant predictor variable since it has a p-value less than .05, but assists does not seem to be statistically significant since it does not have a p-value less than .05.
Additional Resources
The following tutorials explain how to perform other common tasks in Google Sheets:
How to Perform Polynomial Regression in Google Sheets
How to Perform Linear Regression in Google Sheets
How to Calculate R-Squared in Google Sheets